HR 分析:以 R 預測員工流失
Anurag Gupta
People Analytics Practitioner
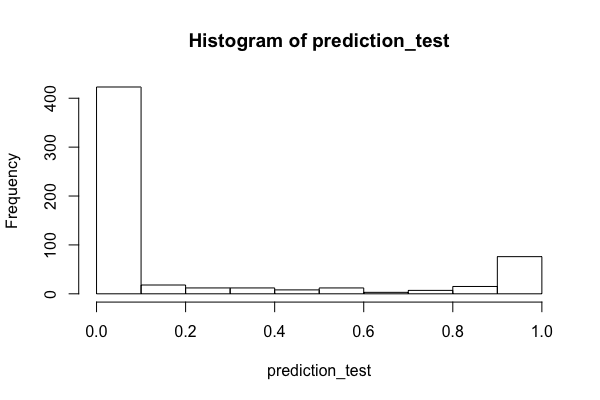
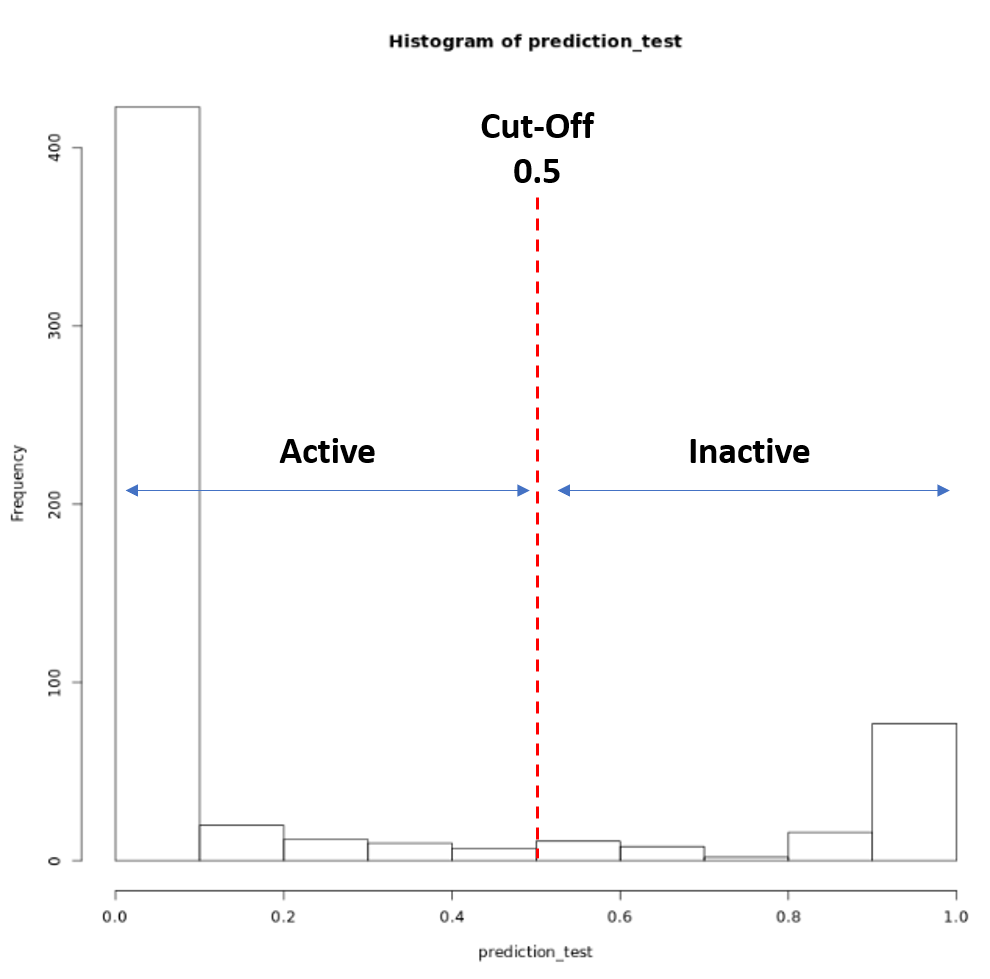
# Classify predictions using a cut-off of 0.5
pred_cutoff_50_test <- ifelse(predictions_test > 0.5, 1, 0)
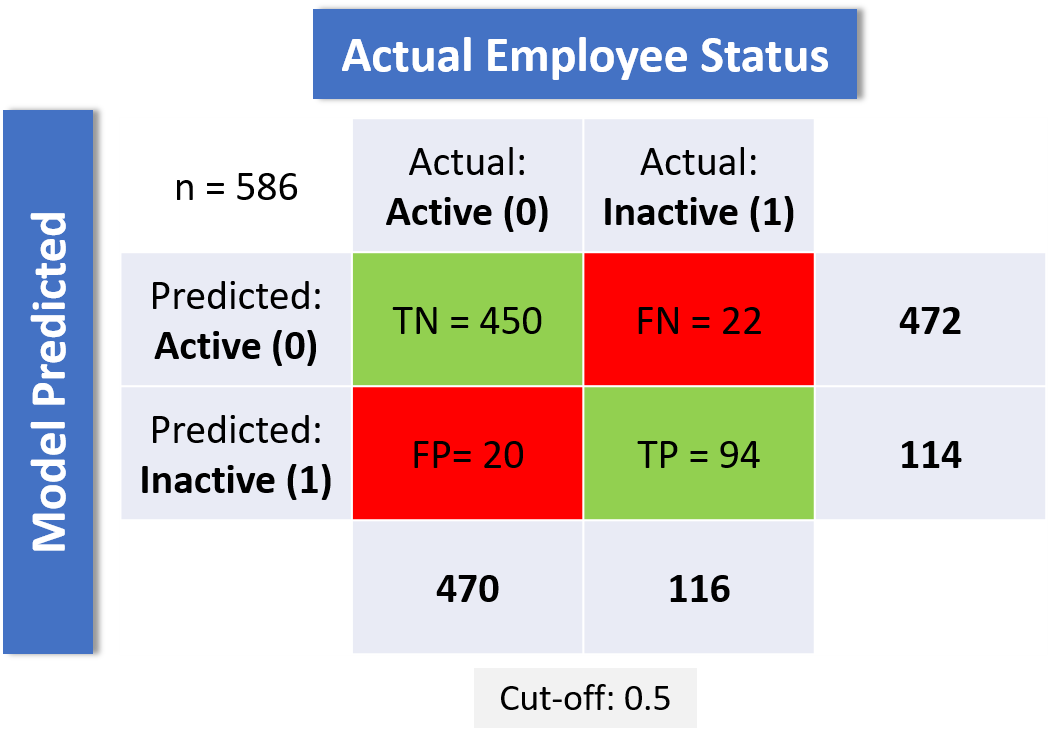
混淆矩陣用來衡量分類模型的表現。
## Creating confusion matrix
table(pred_cutoff_50_test, test_set$turnover)
prediction_categories   0   1
                    0 450  22
                    1  20  94
$$ \text{Accuracy} = \frac{\text{ TP + TN }}{\text{ TP + TN + FP + FN }} $$
$$ \text{Accuracy} = \frac{\text{ 450 + 94 }}{\text{ 450 + 94 + 22 + 20}} $$
$$ = $$
$$ \text{0.9283} $$
# Load library
library(caret)

# Construct a confusion matrix
conf_matrix_50 <- confusionMatrix(table(test_set$turnover,
                                        pred_cutoff_50_test))
conf_matrix_50
Confusion Matrix and Statistics

prediction_categories   0   1
                    0 450  22
                    1  20  94

               Accuracy : 0.9283
                 95% CI : (0.9044, 0.9479)
    No Information Rate : 0.802
    P-Value [Acc > NIR] : <2e-16
                  Kappa : 0.7728
 Mcnemar's Test P-Value : 0.8774
            Sensitivity : 0.9574
            Specificity : 0.8103
         Pos Pred Value : 0.9534
         Neg Pred Value : 0.8246
             ...