R 的 plotly 互動式資料視覺化:中級
Adam Loy
Statistician, Carleton College
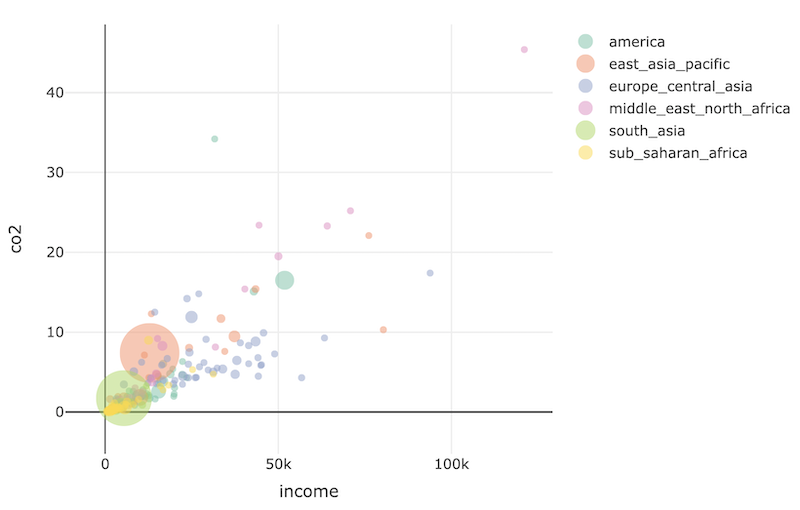
調整標記顏色、大小與符號
打磨 layout() 以提供脈絡
layout()
crosstalk::SharedData$new()
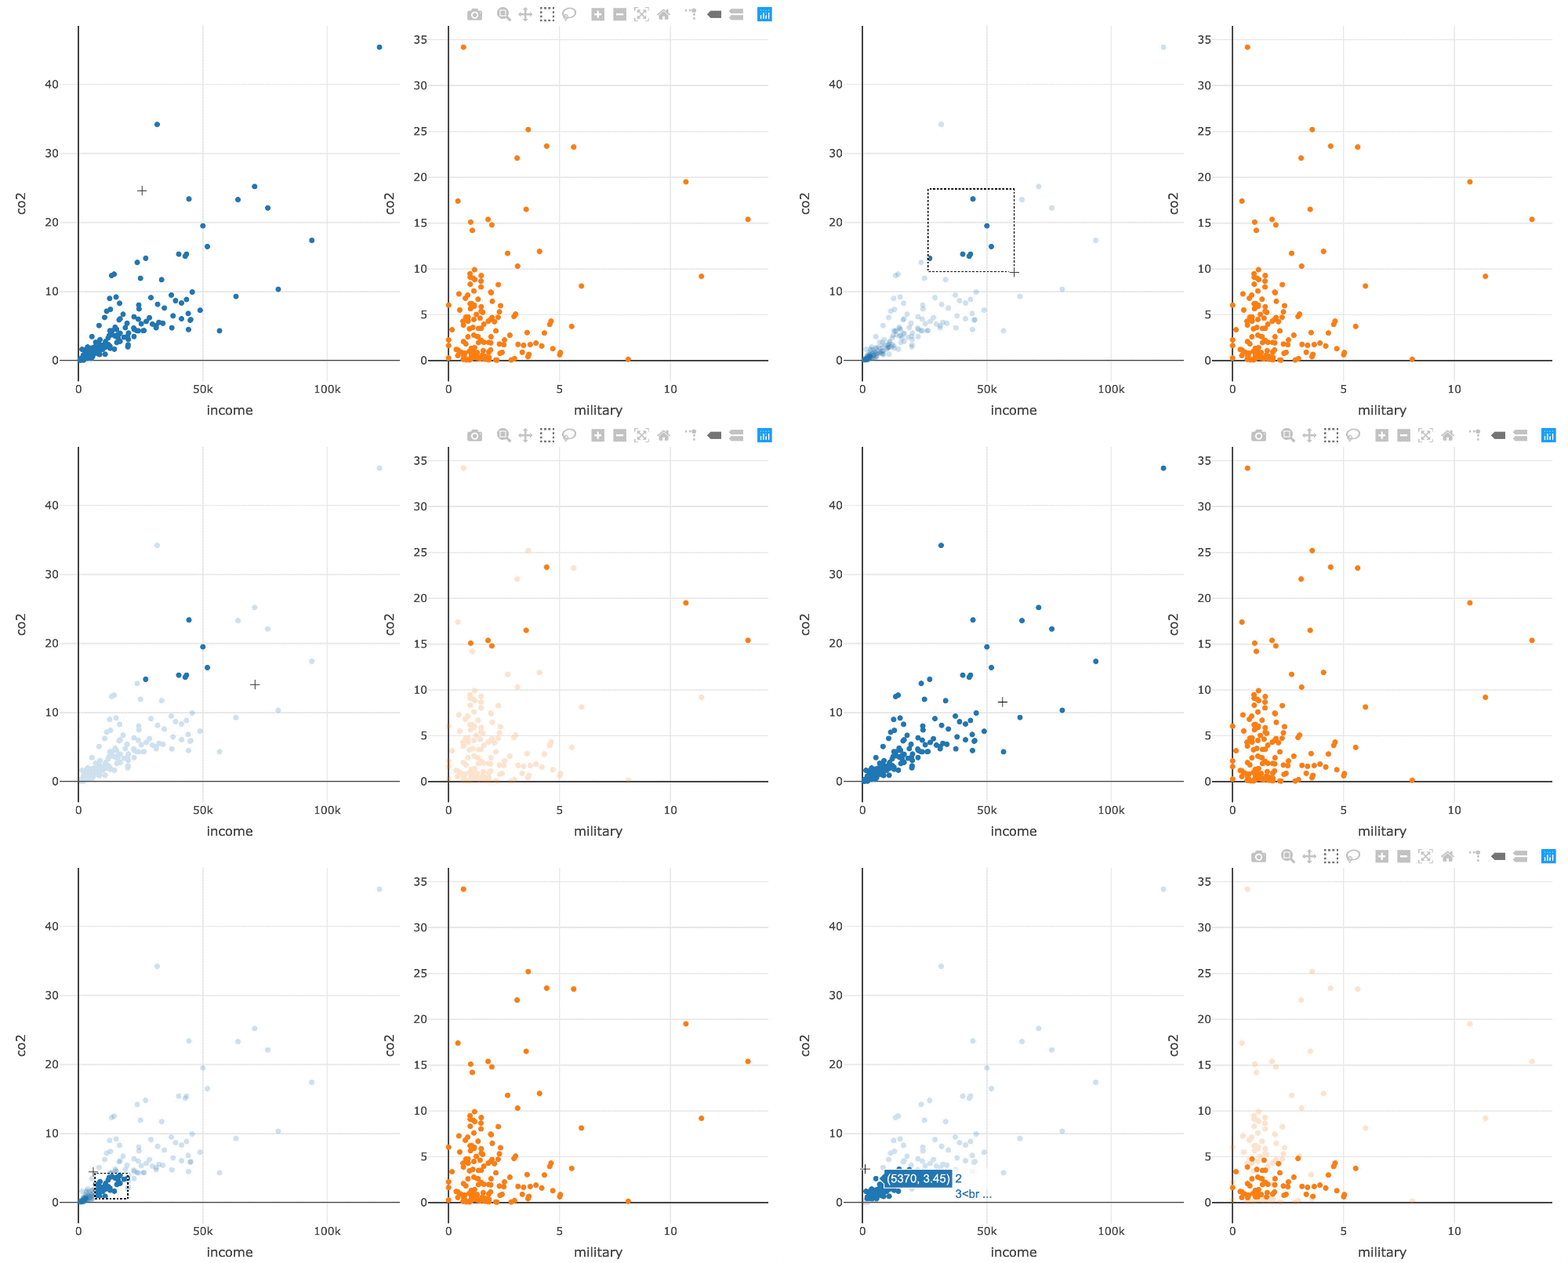
選取
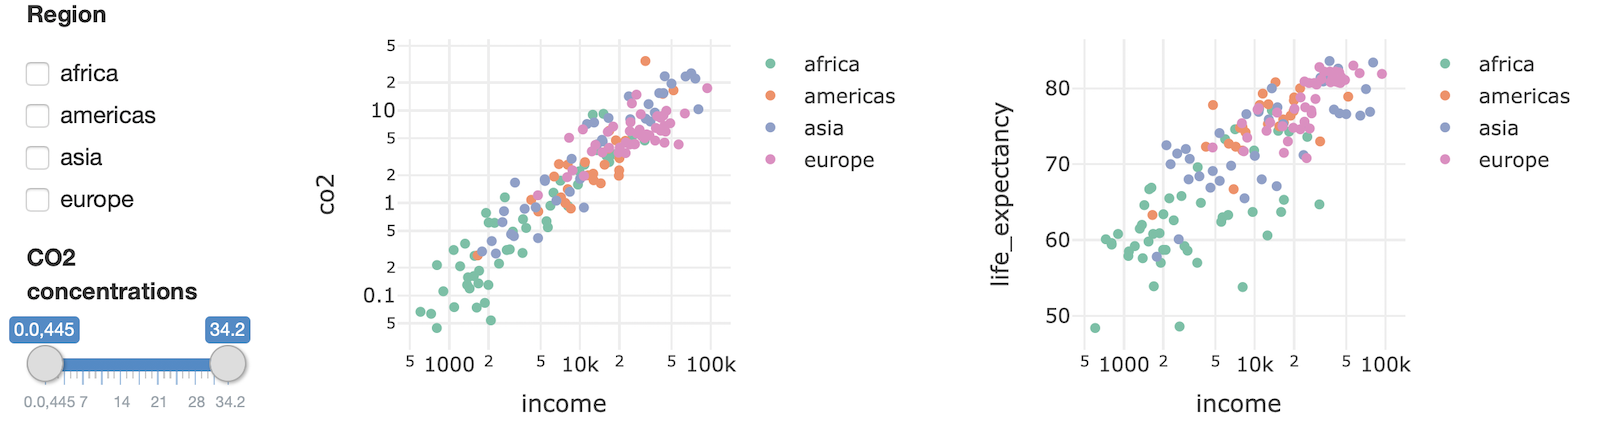
crosstalk::bscols()
探索更多互動式繪圖函式庫
學習 Shiny