R 中的混合模型
Victor Medina
Researcher at The University of Edinburgh
mixtools
bayesmix
EMCluster
flexmix
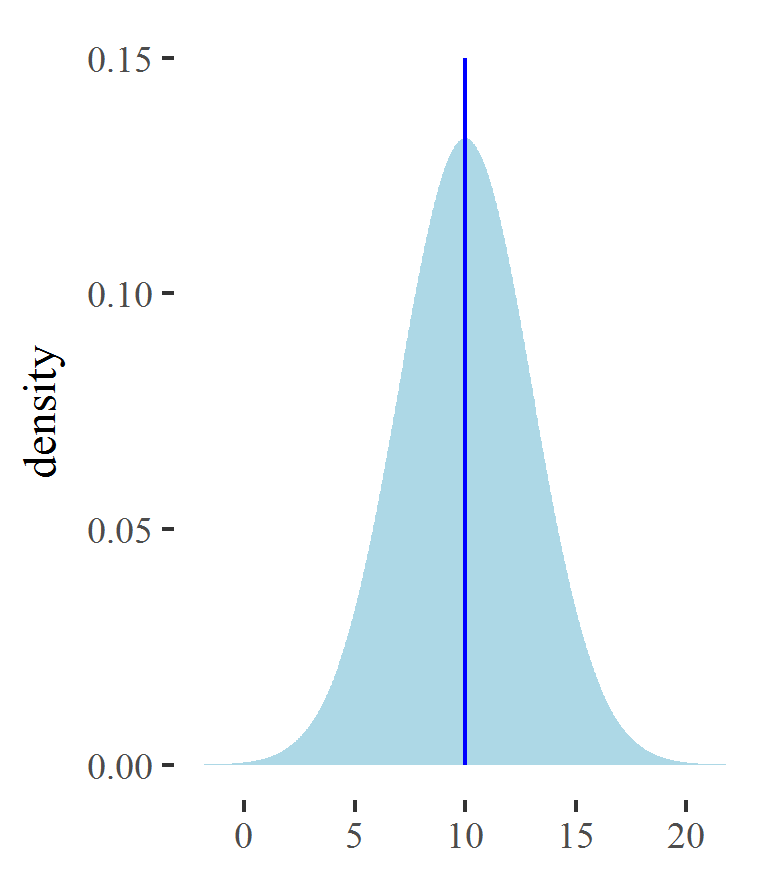
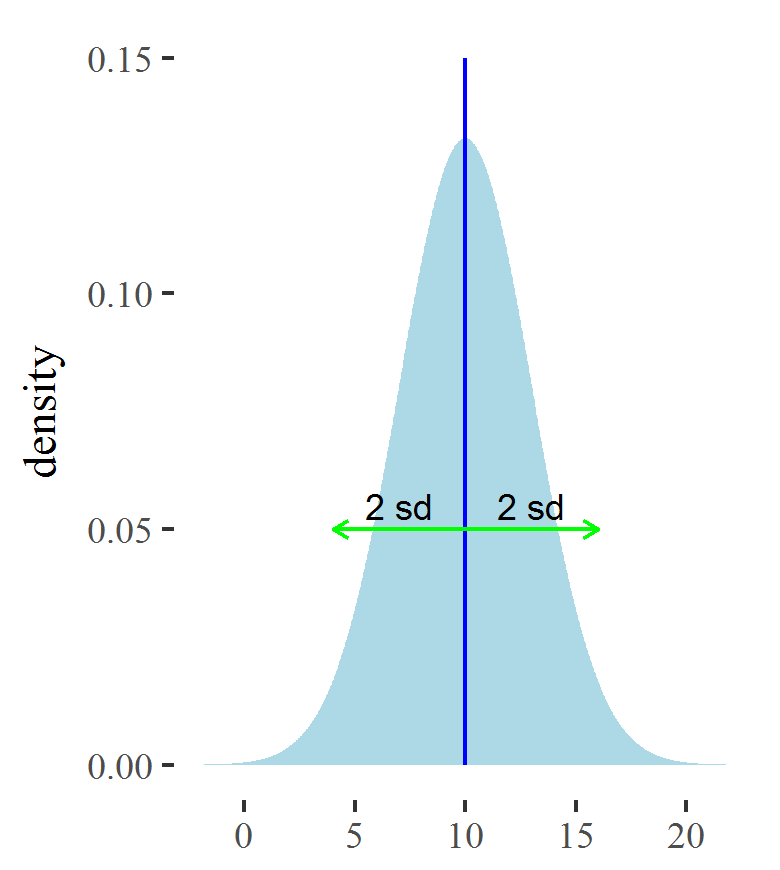
平均數
標準差
從常態分配產生樣本:
rnorm(n, mean, sd)
範例:從平均 10、標準差 5 的常態分配產生 100 個值
> population_sample <- rnorm(n = 100, mean = 10, sd = 5)
> head(population_sample)
[1] 6.248874 9.564190 16.006521 9.139647 10.114969 16.423538
> mean_estimate <- mean(population_sample)
10.35759
估計 sd 可依下列步驟:
sd
$$value_i\rightarrow (. -mean\_estimate)\rightarrow (.)^2\rightarrow mean (.)\rightarrow \sqrt{(.)}$$
> population_sample %>%
+   subtract(mean_estimate) %>%
+   raise_to_power(2) %>% mean() %>% sqrt()
5.318641
> standard_deviation_estimate <- sd(population_sample)
> standard_deviation_estimate
5.345435
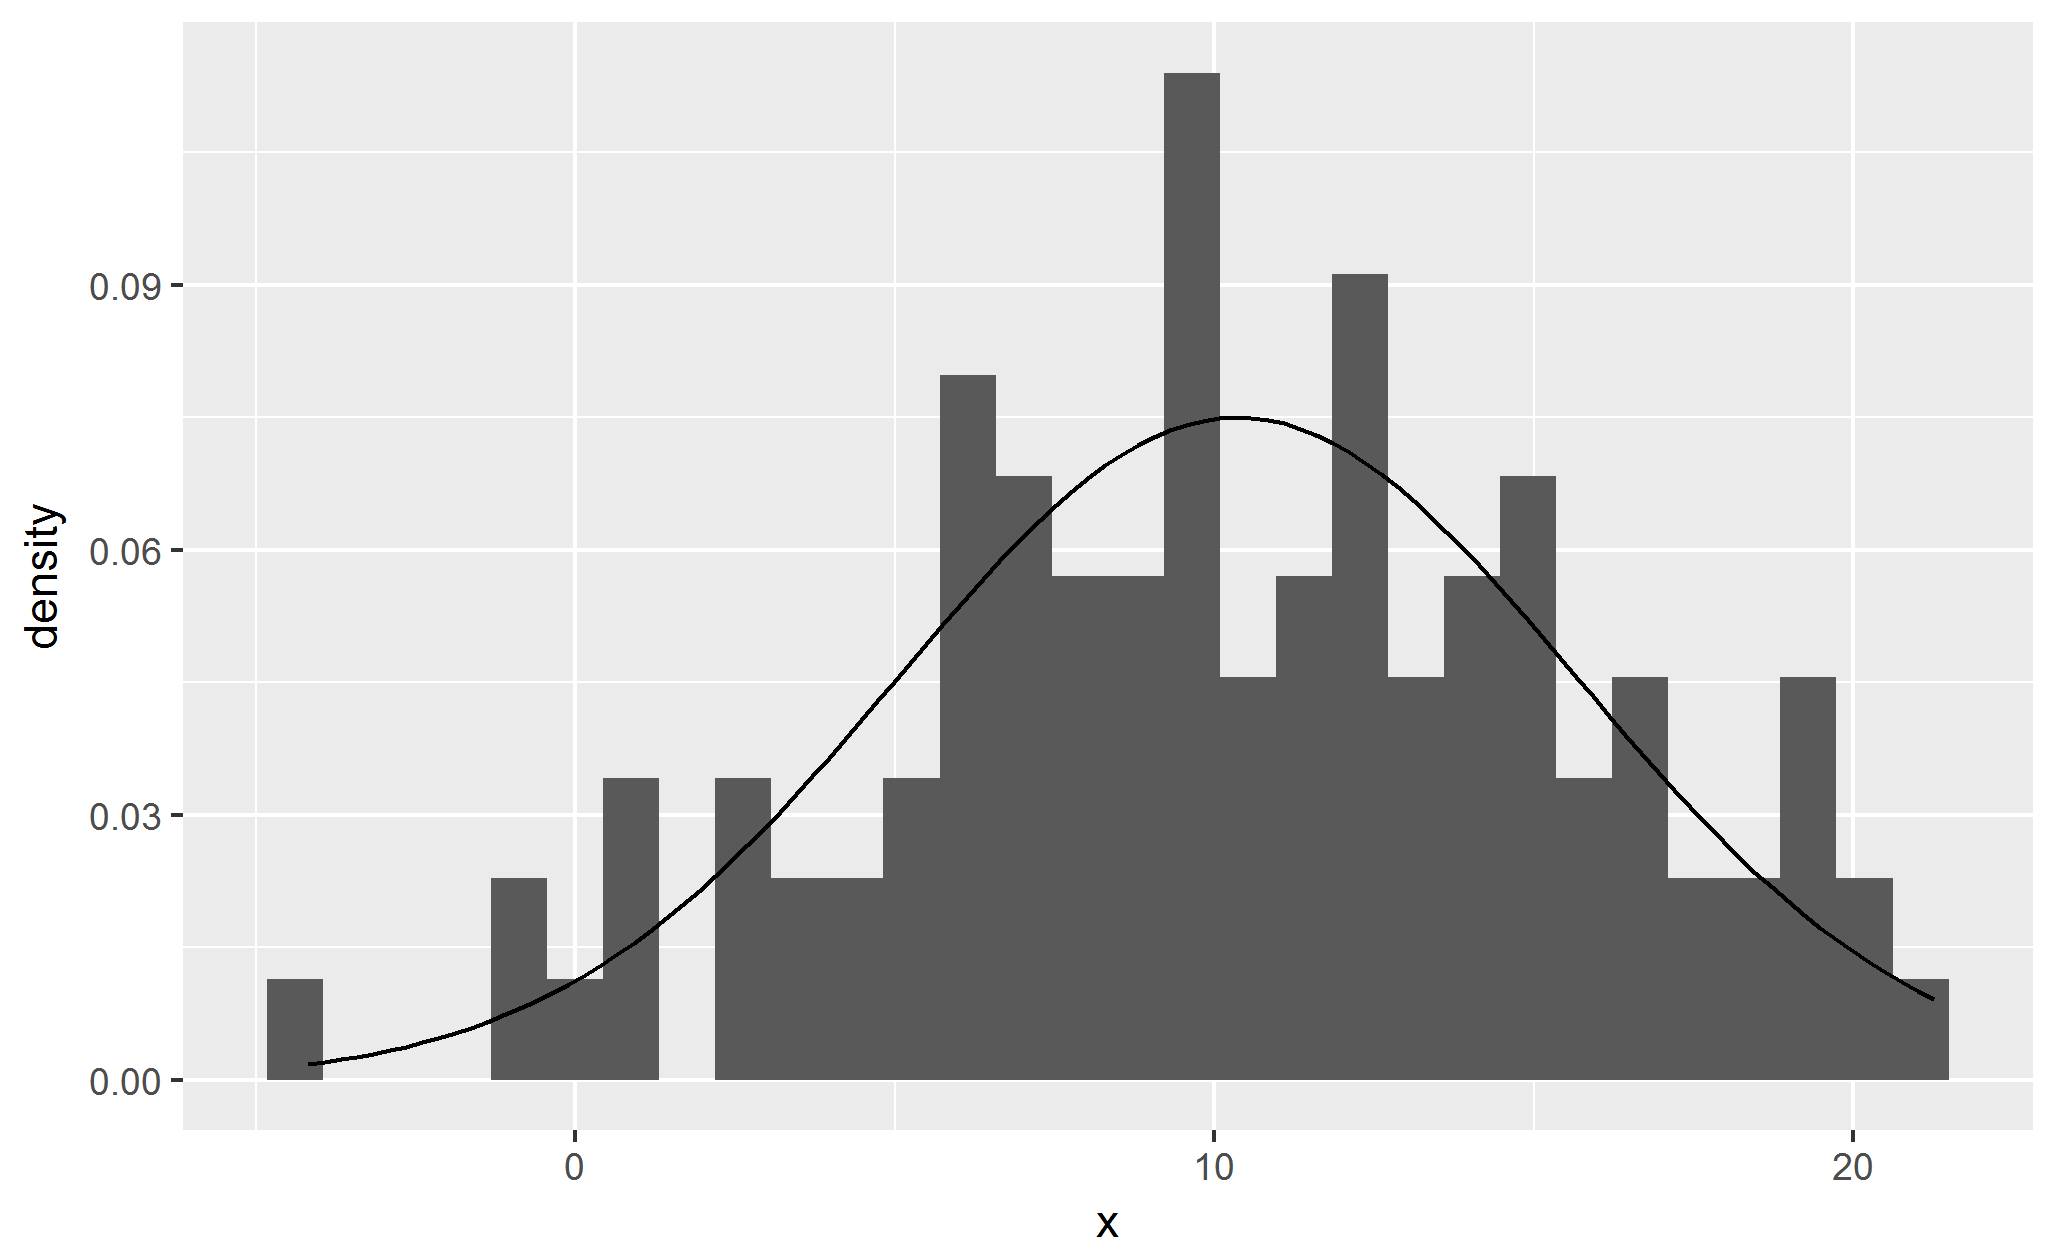
# 將樣本轉成資料框
population_sample <- data.frame(x = population_sample)

# 繪製長條圖
ggplot(data = population_sample) +
   geom_histogram(aes(x = x, y = ..density..)) +
   stat_function(geom = "line",
                 fun = dnorm,
                 args = list(mean = mean_estimate,
                             sd = standard_deviation_estimate))