把資料化為洞見

善用 Microsoft Copilot

Susanth Sutheesh

Copilot Solution Engineer, Microsoft

為何用 Excel 做視覺推理?
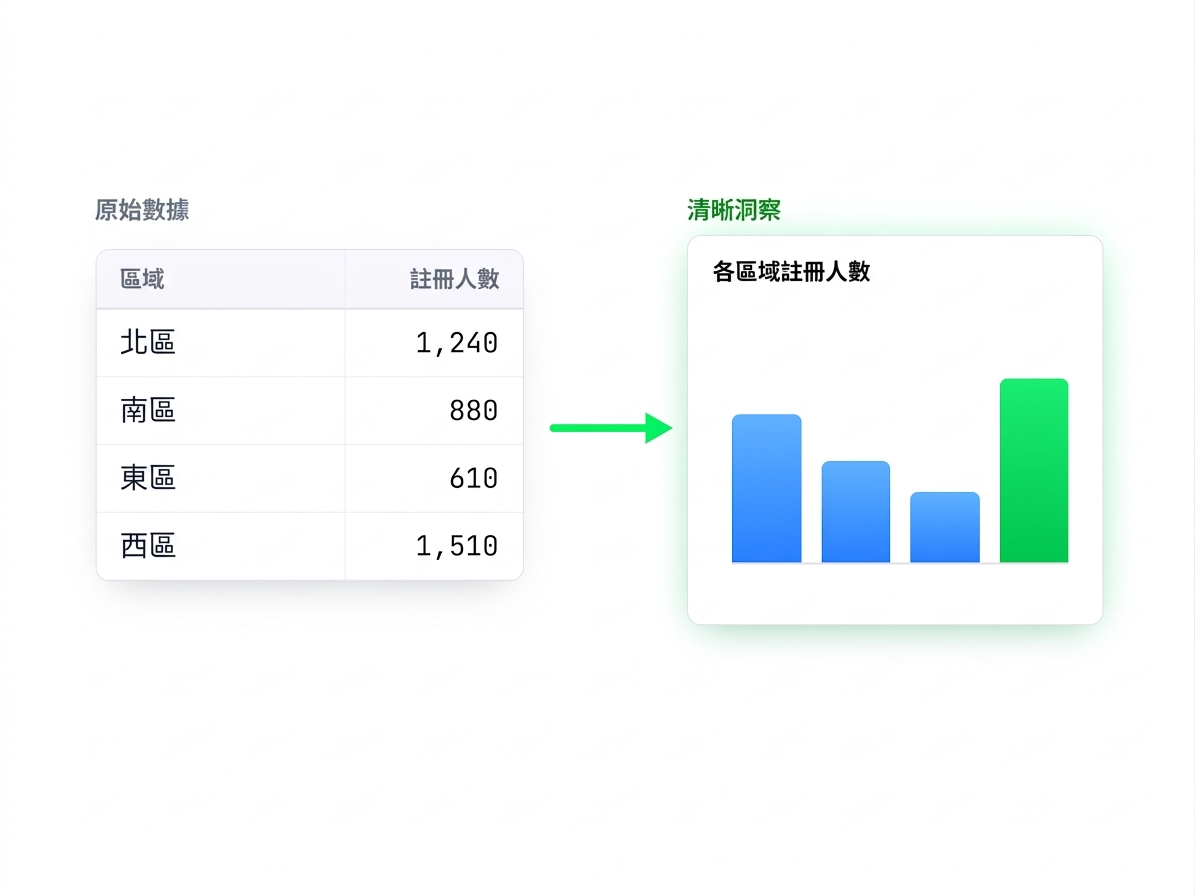
 

  • 視覺推理:把數字轉成可思考的表格、圖表或摘要
  • Copilot 讀取你的資料並完成分析
  • 它會為你撰寫公式並建立圖表


原始地區註冊數表轉為乾淨的長條圖,示範 Copilot 如何把數字轉成清晰視覺

善用 Microsoft Copilot

為何用 Excel 做視覺推理?


它也能:

  • 摘要工作表的實際內容
  • 找出趨勢、離群值與總計
  • 依你描述新增公式欄
  • 建立圖表,並可依要求調整


圖解:你的試算表提供給 Analyst 代理人,回傳洞見與圖表

善用 Microsoft Copilot

從資料到摘要表

  • Copilot App-附檔提問
  • Excel for the web-原生使用 Copilot

$$

在 Copilot app,已附上檔案

上傳資料並請它做摘要:

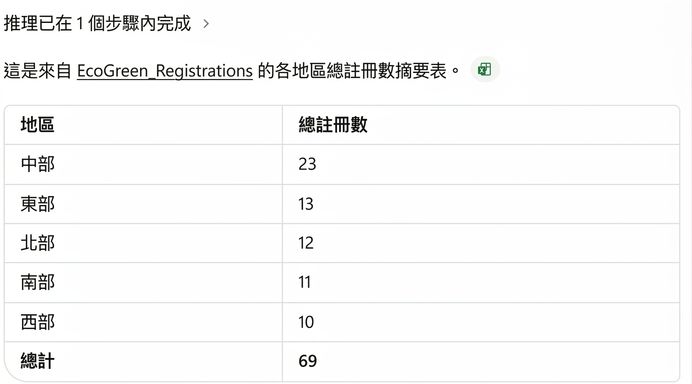
Using the attached file, show total registrations by region as a summary table


Copilot 產生的各地區註冊數摘要表

善用 Microsoft Copilot

優化視覺化


把表格轉為圖表:

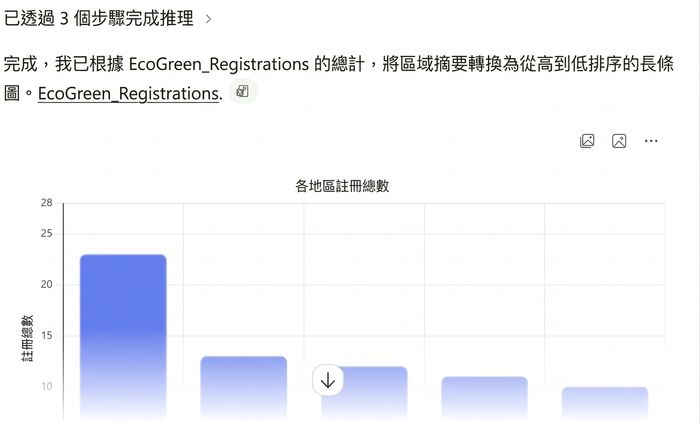
Now show that as a bar chart, sorted from highest to lowest


Copilot 產生並排序的各地區註冊數長條圖

善用 Microsoft Copilot

超越 Excel 的視覺推理


從摘要表,到排序圖表,再到短敘述的演進


  • 在 Word 中,Copilot 可把文字轉成表格
  • 在 PowerPoint 中,可依描述資料建立投影片圖表
善用 Microsoft Copilot

超越 Excel 的視覺推理

並排比較:Word 與 PowerPoint 接受純文字指令,Excel 則可讓你指定 Copilot 作用於表格或範圍

善用 Microsoft Copilot

在 Excel 搭配 Copilot 的最佳做法

綠色 Excel 工作表,包含 Region、Sales、Profit 欄位標籤,象徵清楚的資料結構

$$

  • 參照資料時一律使用精確的欄名
  • 清楚指定圖表類型與座標軸標籤
  • 逐步細化,突顯最重要的重點
善用 Microsoft Copilot

一起來練習吧!

善用 Microsoft Copilot

Preparing Video For Download...