Validating logistic regression results
HR Analytics: Predicting Employee Churn in R

Anurag Gupta
People Analytics Practitioner
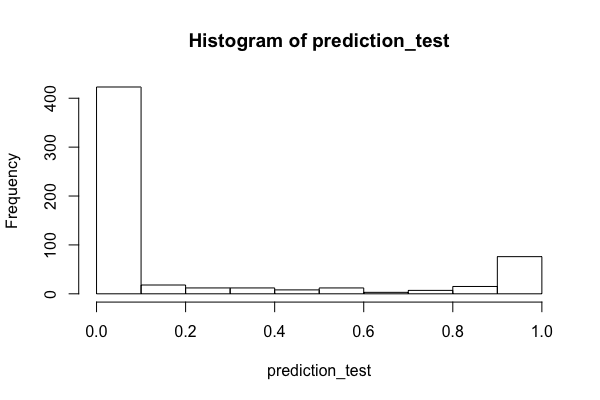
Turnover probability distribution of test cases
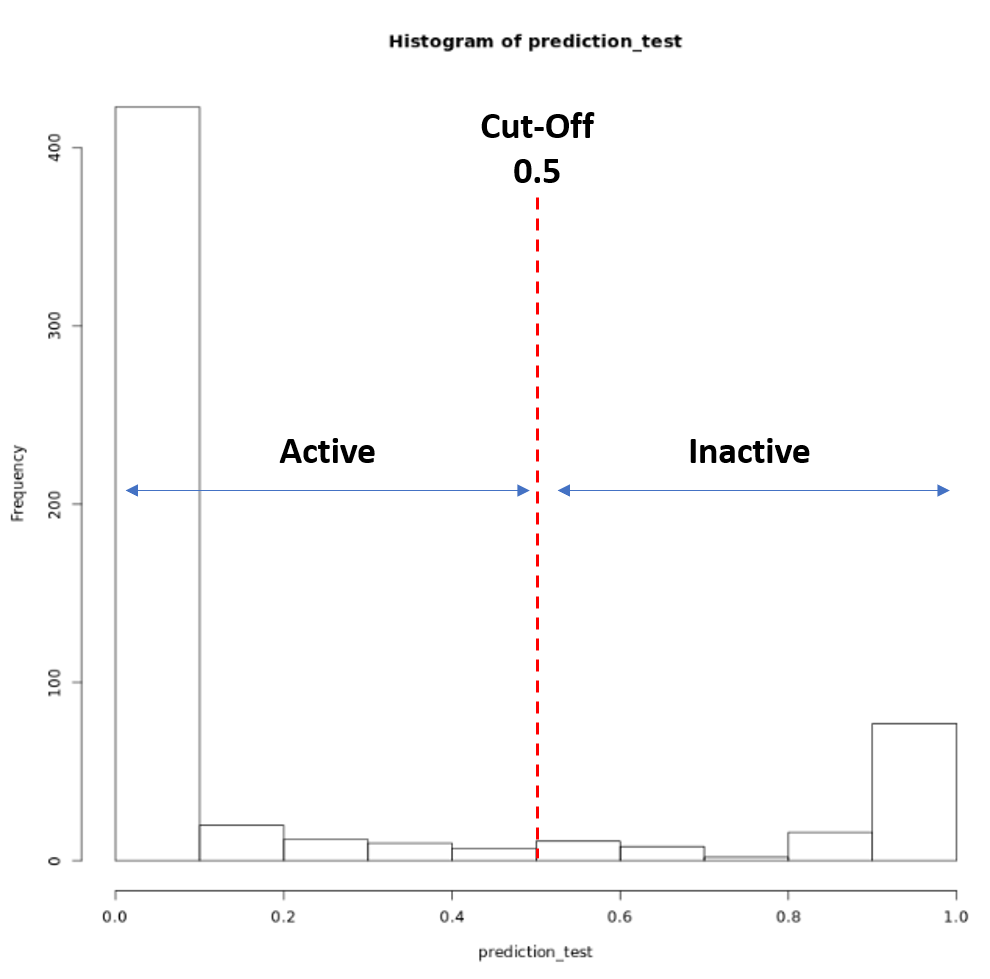
Turn probabilities in categories by using a cut-off
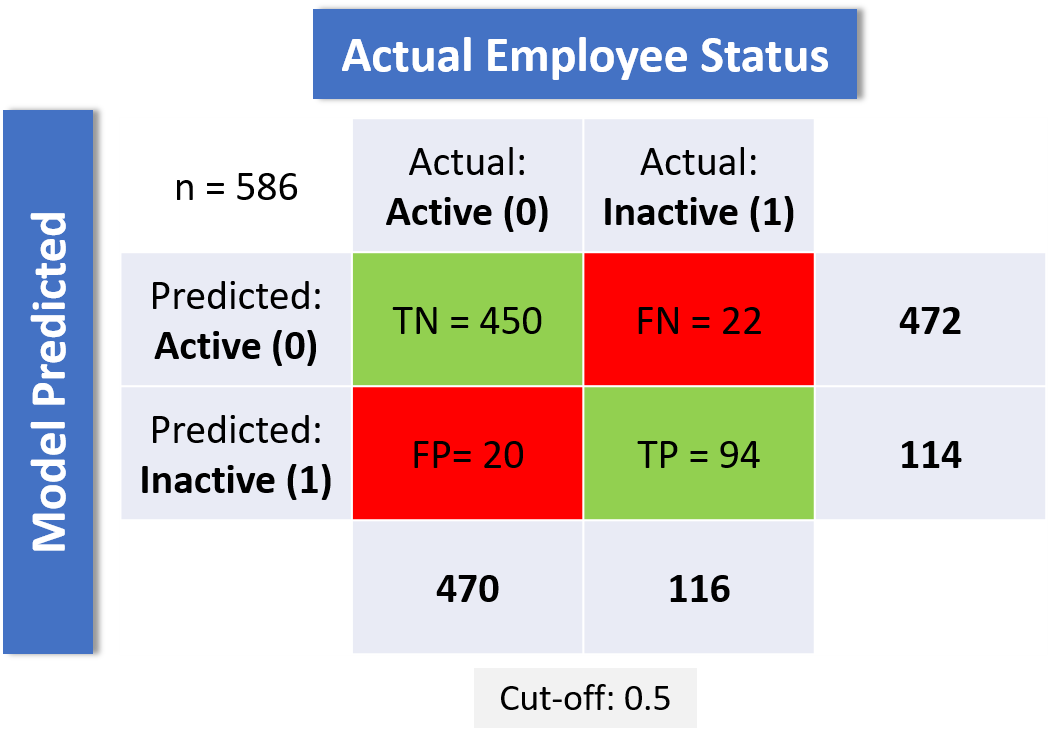
Understanding confusion matrix