Compensation
HR Analytics: Predicting Employee Churn in R

Abhishek Trehan
People Analytics Practitioner
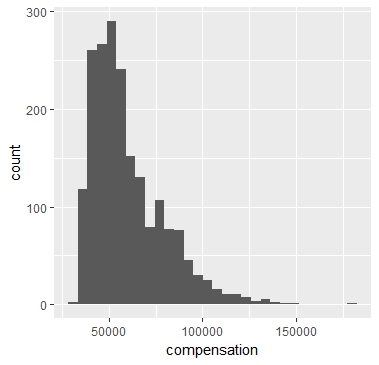
Exploring compensation variable
# Plot the distribution of compensation
ggplot(emp_tenure, aes(x = compensation)) +
  geom_histogram()
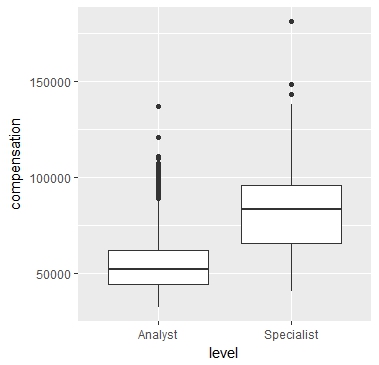
Exploring compensation variable
# Plot the distribution of compensation across levels
ggplot(emp_tenure,
       aes(x = level, y = compensation)) +
  geom_boxplot()
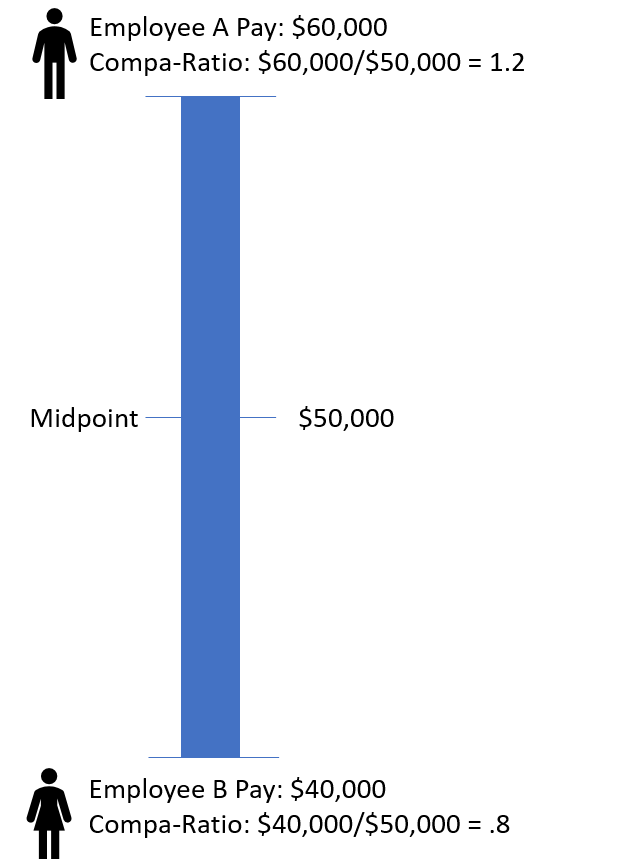
Deriving Compa-ratio