Exploring your data using visualizations
Marketing Analytics: Predicting Customer Churn in Python

Mark Peterson
Director of Data Science, Infoblox
Visualizing data in Python
seabornlibrary allows you to easily create informative and attractive plotsBuilds on top of
matplotlib
Visualizing the distribution of account lengths
- Important to understand how your variables are distributed
import matplotlib.pyplot as plt import seaborn as snssns.distplot(telco['Account_Length'])plt.show()
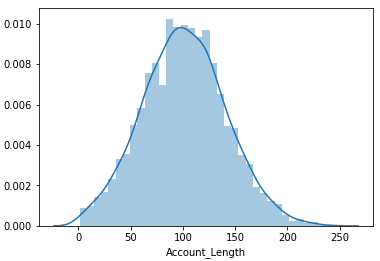
Differences in account length
- Box plot
sns.boxplot(x = 'Churn',
            y = 'Account_Length',
            data = telco)

plt.show()
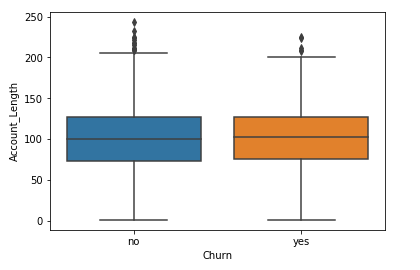
Differences in account lengths
- Box plot
sns.boxplot(x = 'Churn',
            y = 'Account_Length',
            data = telco)

plt.show()
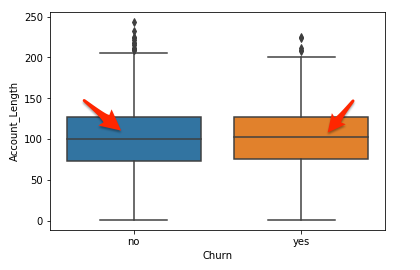
Differences in account lengths
- Box plot
sns.boxplot(x = 'Churn',
            y = 'Account_Length',
            data = telco)

plt.show()
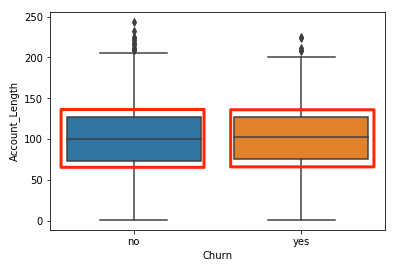
Differences in account lengths
- Box plot
sns.boxplot(x = 'Churn',
            y = 'Account_Length',
            data = telco)

plt.show()
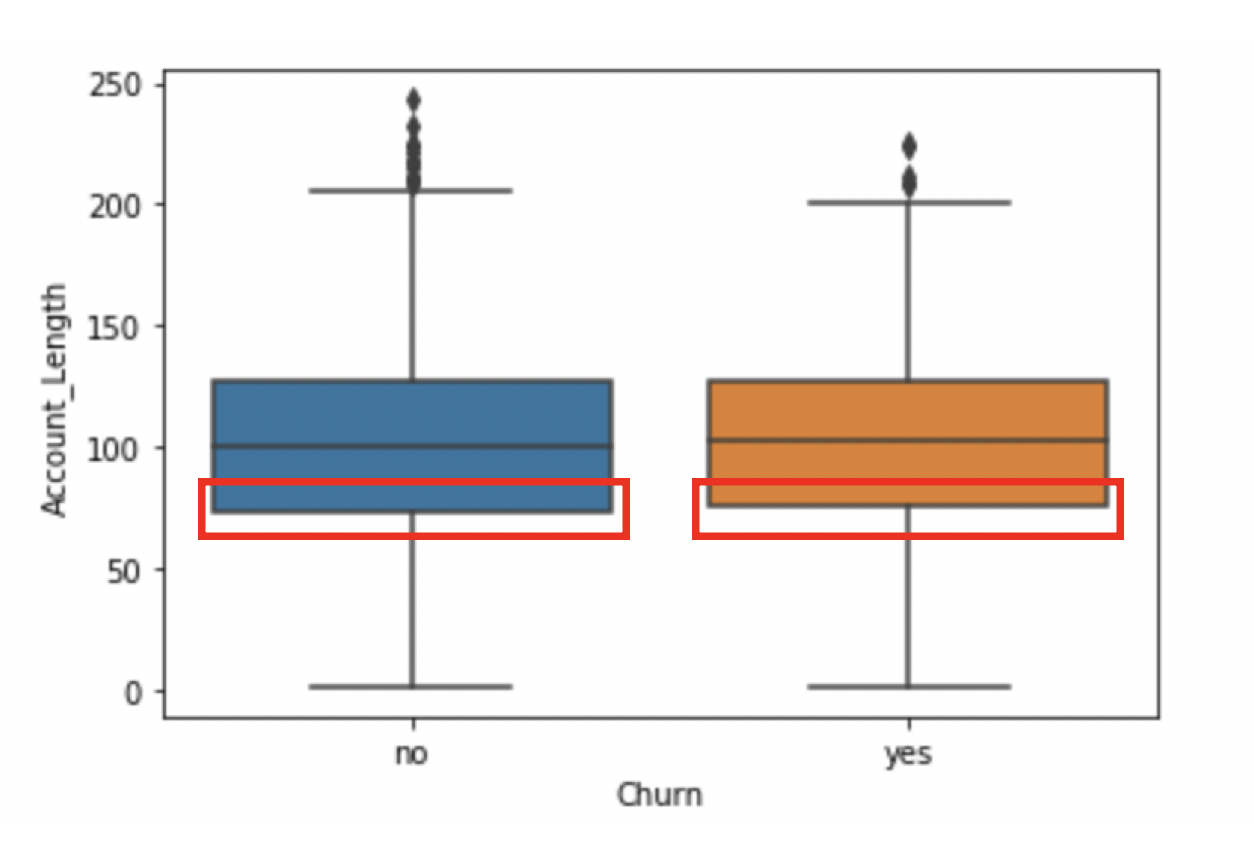
Differences in account lengths
- Box plot
sns.boxplot(x = 'Churn',
            y = 'Account_Length',
            data = telco)

plt.show()
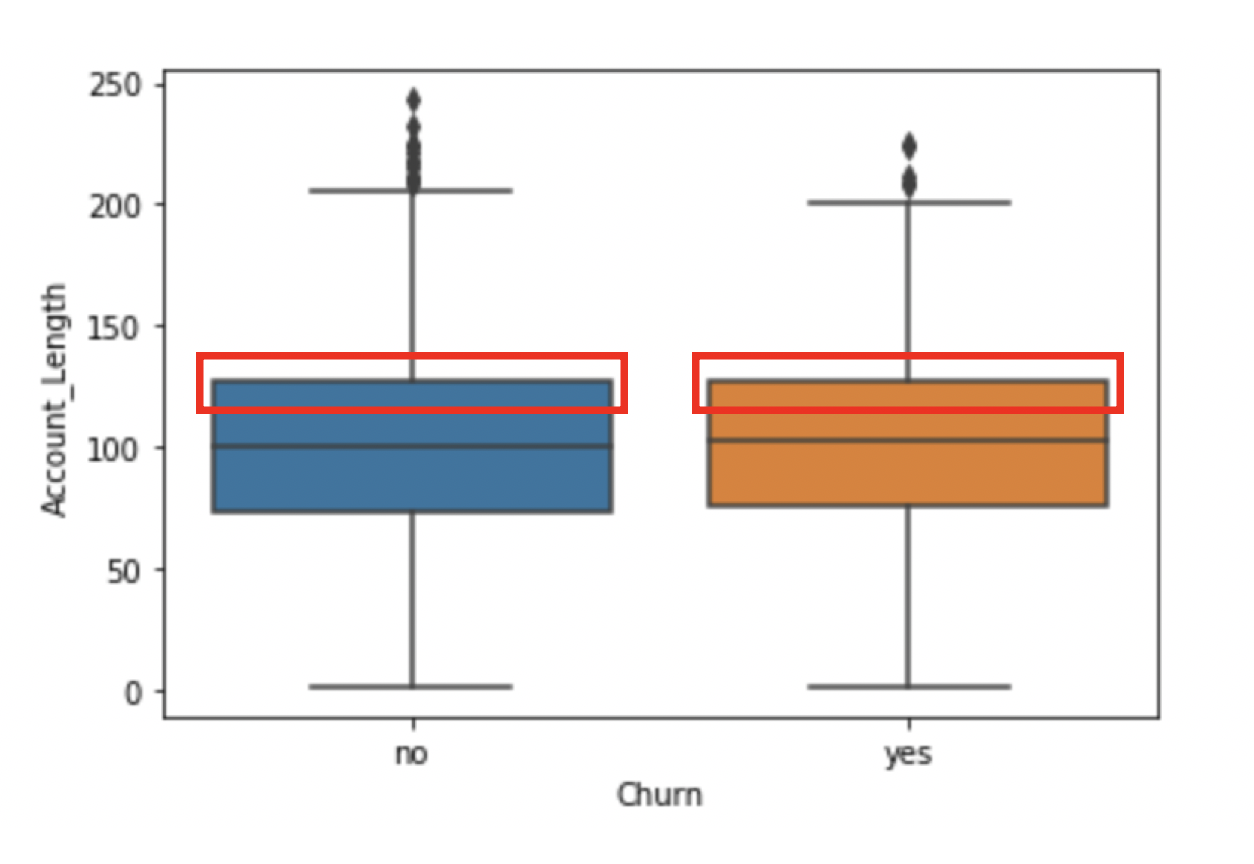
Differences in account lengths
- Box plot
sns.boxplot(x = 'Churn',
            y = 'Account_Length',
            data = telco)

plt.show()

Differences in account length
- Box plot
sns.boxplot(x = 'Churn',
            y = 'Account_Length',
            data = telco)

plt.show()

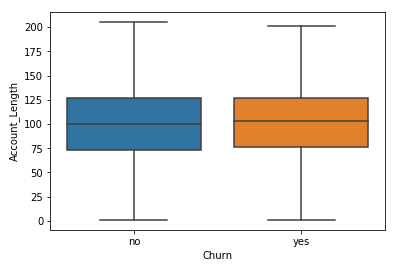
Differences in account length
- Box plot
sns.boxplot(x = 'Churn',
            y = 'Account_Length',
            data = telco,
            sym="")

plt.show()
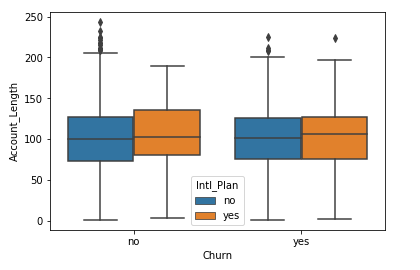
Adding a third variable
sns.boxplot(x = 'Churn',
            y = 'Account_Length',
            data = telco,
            hue = 'Intl_Plan')

plt.show()
Let's make some plots!
Marketing Analytics: Predicting Customer Churn in Python

