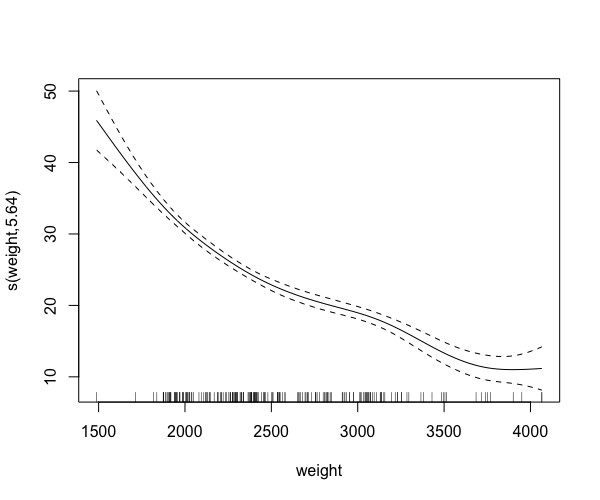
The plot command
Nonlinear Modeling with Generalized Additive Models (GAMs) in R

Noam Ross
Senior Research Scientist, EcoHealth Alliance
Selecting partial effects
plot(gam_model, select = c(2, 3))
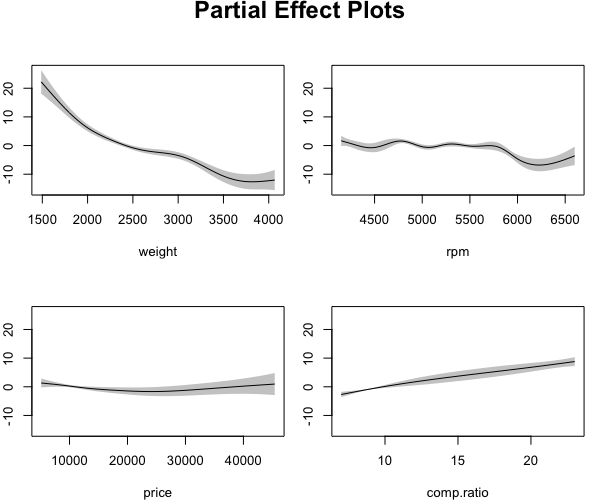
plot(gam_model, pages = 1)
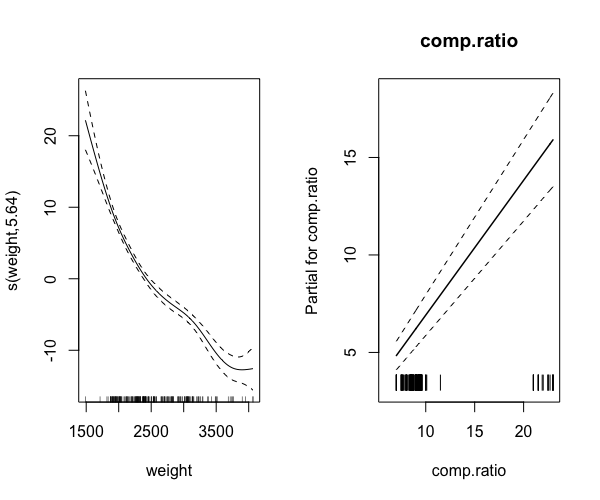
plot(gam_model, pages = 1, all.terms = TRUE)
Showing data on the plots
plot(gam_model, rug = TRUE)

Showing data on the plots (2)
plot(gam_model, residuals = TRUE)
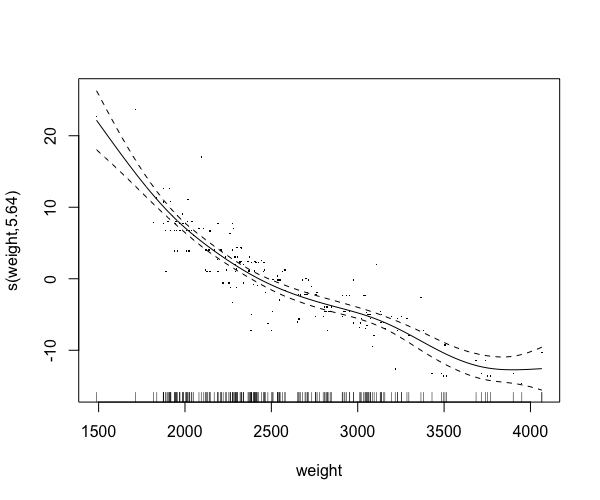
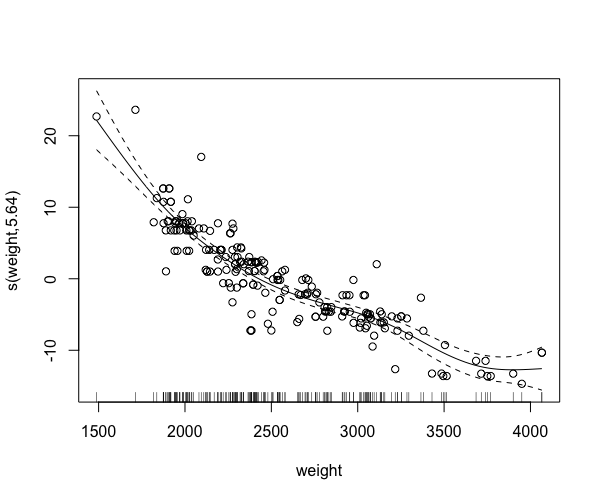
Showing data on the plots (3)
plot(gam_model, rug = TRUE, residuals = TRUE,
     pch = 1, cex = 1)
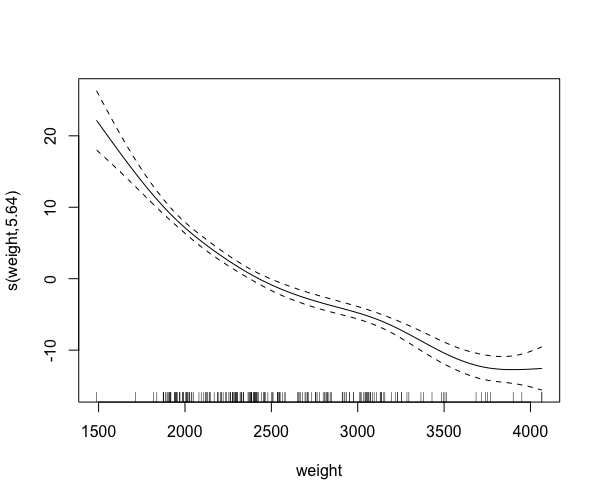
Showing standard errors
plot(gam_model, se = TRUE)

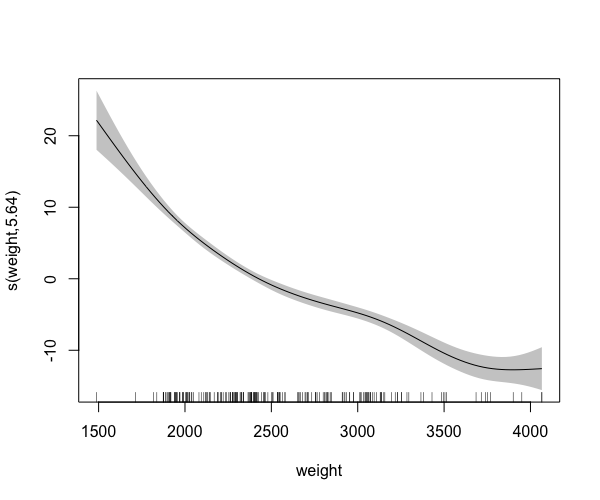
Showing standard errors (2)
plot(gam_model, shade = TRUE)
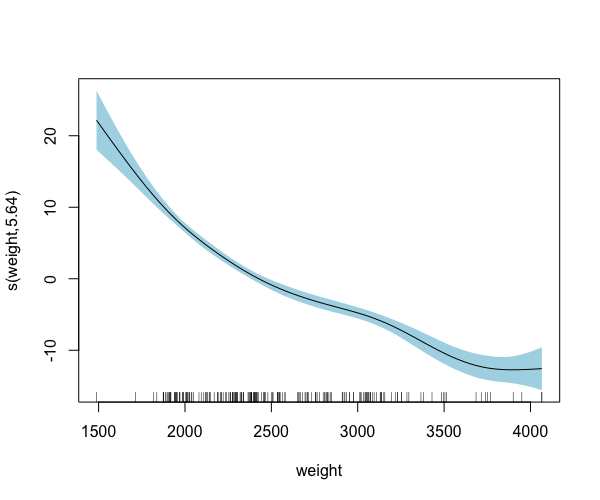
Showing standard errors
plot(gam_model, shade = TRUE, shade.col = "lightblue")
Transforming standard errors
plot(gam_model, seWithMean = TRUE)
Transforming standard errors (2)
plot(gam_model, seWithMean = TRUE, shift = coef(gam_model)[1])