Create Diagrams with semPaths()

Structural Equation Modeling with lavaan in R

Erin Buchanan

Professor

semPlot and semPaths()

library(lavaan)
library(semPlot)
twofactor.model <- 'text =~ x4 + x5 + x6
    speed =~ x7 + x8 + x9'
twofactor.fit <- cfa(model = twofactor.model, 
                     data = HolzingerSwineford1939)
semPaths(object = twofactor.fit)
Structural Equation Modeling with lavaan in R

semPaths() Default Output
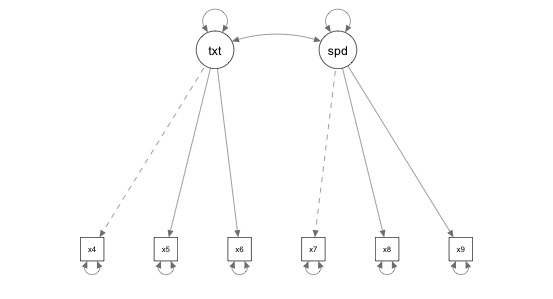
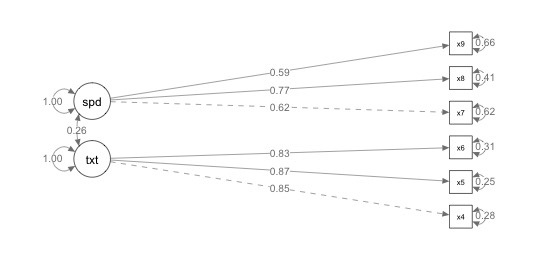
Default Plot from semPaths

Structural Equation Modeling with lavaan in R

Editing the Picture

semPaths(object = twofactor.fit,
         whatLabels = "std", 
         edge.label.cex = 1)
#whatLabels can also be "par" 
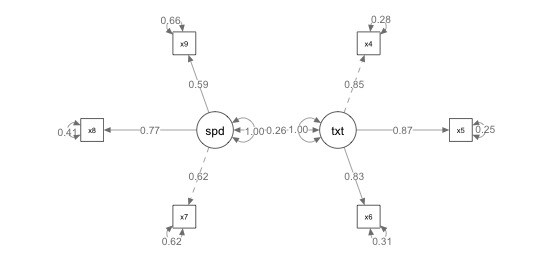
Updated Model Picture with Edge Labels

Structural Equation Modeling with lavaan in R

Picture Layout

semPaths(object = twofactor.fit,
          whatLabels = "std", 
          edge.label.cex = 1, 
          layout = "circle")
#layout options are tree, circle, spring, tree2, circle2
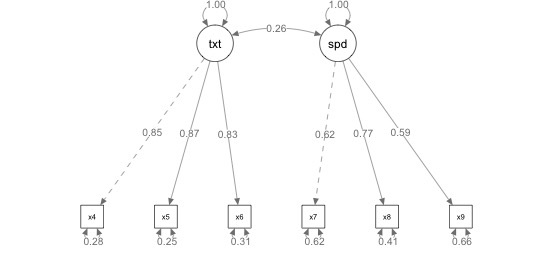
Updated Layout to Circle Option

Structural Equation Modeling with lavaan in R

Picture Rotation

semPaths(object = twofactor.fit,
          whatLabels = "std", 
          edge.label.cex = 1, 
          layout = "tree", rotation = 2)
#rotation options are 1, 2, 3, 4 for tree layouts
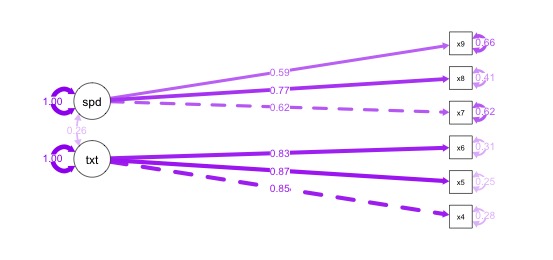
Updated Tree Rotation with Latents on the Left

Structural Equation Modeling with lavaan in R

Color Visualization

semPaths(object = twofactor.fit,
         whatLabels = "std", 
         edge.label.cex = 1, 
         layout = "tree", rotation = 2,
         what = "std", edge.color = "purple")
#what options include par and std

Updated Color to Shaded Purple

Structural Equation Modeling with lavaan in R

Let's practice!

Structural Equation Modeling with lavaan in R

Preparing Video For Download...