Visualizing the results

Differential Expression Analysis with limma in R

John Blischak

Instructor

Inspecting the results

results <- decideTests(fit2)
summary(results)
topTable(fit2, number = 3)
   status
-1   6276
0   11003
1    5004
            symbol entrez  chrom    logFC  AveExpr        t
205225_at     ESR1   2099 6q25.1 3.762901 11.37774 22.68392
209603_at    GATA3   2625  10p15 3.052348  9.94199 18.98154
209604_s_at  GATA3   2625  10p15 2.431309 13.18533 17.59968
                 P.Value    adj.P.Val        B
205225_at   2.001001e-70 4.458832e-66 149.1987
209603_at   1.486522e-55 1.656209e-51 115.4641
209604_s_at 5.839050e-50 4.337052e-46 102.7571
Differential Expression Analysis with limma in R

Obtain results for all genes

stats <- topTable(fit2, number = nrow(fit2), sort.by = "none")
dim(stats)
22283     9
Differential Expression Analysis with limma in R

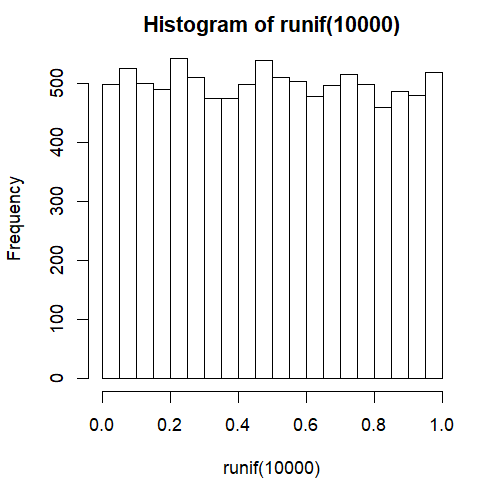
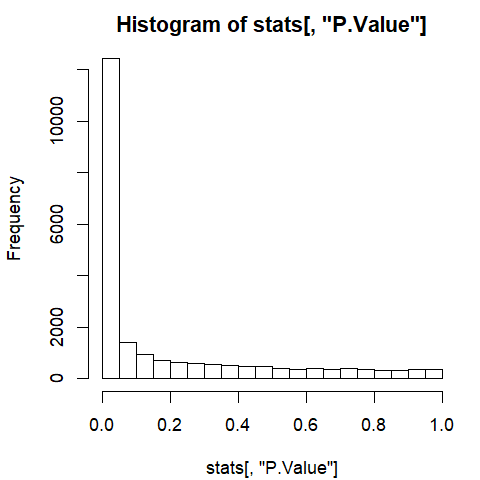
Histogram of p-values

hist(runif(10000))

hist(stats[, "P.Value"])
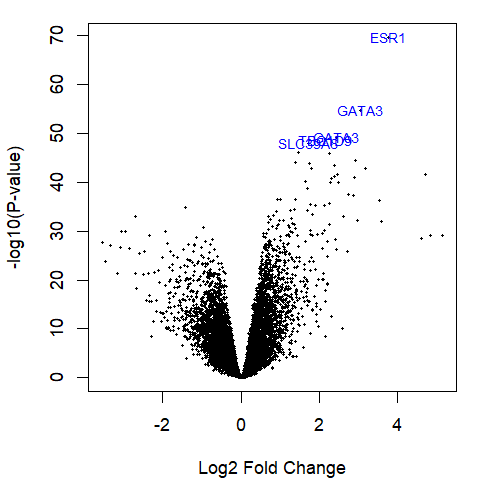
Differential Expression Analysis with limma in R

Volcano plot

volcanoplot(fit2, 
            highlight = 5, 
            names = fit2$genes[, "symbol"])

Differential Expression Analysis with limma in R

Let's practice!

Differential Expression Analysis with limma in R

Preparing Video For Download...