EFA vs. CFA revisited

Factor Analysis in R

Jennifer Brussow

Psychometrician

Review of the differences between EFA & CFA

EFA:

  • Estimates all possible variable/factor relationships
  • Looking for patterns in the data
  • Use when you don't have a well-developed theory

CFA:

  • Only specified variable/factor relationships
  • Testing a theory that you know in advance
  • This is the right thing to publish!
Factor Analysis in R
# View the first five rows of the EFA loadings
EFA_model$loadings[1:5,]
           MR2         MR1          MR3        MR5         MR4
A1  0.24282081 -0.15387946 0.0780303740 -0.3897470 -0.08461786
A2 -0.02320759  0.01798410 0.0679900414  0.6584172 -0.01095097
A3 -0.05917275 -0.12693134 0.0238309309  0.6154942  0.05036830
A4 -0.03852599 -0.08709392 0.1936172346  0.4005924 -0.17361760
A5 -0.13355262 -0.23429925 0.0001429341  0.5075002  0.07523716
# View the first five loadings from the CFA estimated from the EFA results
summary(EFA_CFA)$coeff[1:5,]
       Estimate  Std Error   z value      Pr(>|z|)            
F4A1 -0.5038817 0.04497739 -11.20300  3.941591e-29 A1 <--- MR5
F4A2  0.8207622 0.03465055  23.68684 4.927422e-124 A2 <--- MR5
F4A3  1.0360812 0.03700471  27.99863 1.688392e-172 A3 <--- MR5
F4A4  0.8264718 0.04471746  18.48208  2.878650e-76 A4 <--- MR5
F4A5  0.9012645 0.03688629  24.43359 7.520155e-132 A5 <--- MR5
Factor Analysis in R

Comparing factor loadings

# View the first five loadings from the CFA estimated from the EFA results
summary(EFA_CFA)$coeff[1:5, ]
       Estimate  Std Error   z value      Pr(>|z|)            
F4A1 -0.5038817 0.04497739 -11.20300  3.941591e-29 A1 <--- MR5
# View the first five rows of the EFA loadings
EFA_model$loadings[1:5, ]
           MR2         MR1          MR3        MR5         MR4
A1                                      -0.3897470
Factor Analysis in R

Differences in factor scores

# Extracting factor scores from the EFA model
EFA_scores <- EFA_model$scores
# Calculate factor scores for the EFA dataset
CFA_scores <- fscores(EFA_CFA, data = bfi_EFA)
Factor Analysis in R

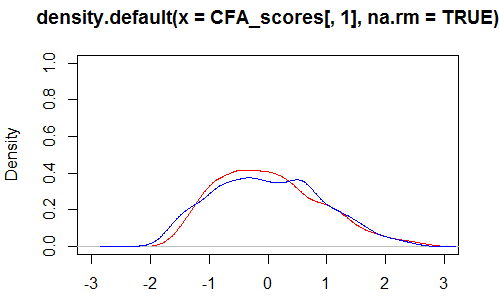
Differences in factor scores, visualized

plot(density(EFA_scores[,1], na.rm = TRUE), 
     xlim = c(-3, 3), ylim = c(0, 1), col = "blue")
lines(density(CFA_scores[,1], na.rm = TRUE), 
     xlim = c(-3, 3), ylim = c(0, 1), col = "red")

Density plot of EFA and CFA factor scores

Factor Analysis in R

Let's practice!

Factor Analysis in R

Preparing Video For Download...