Determining dimensionality
Factor Analysis in R

Jennifer Brussow
Psychometrician
How many dimensions does your data have?


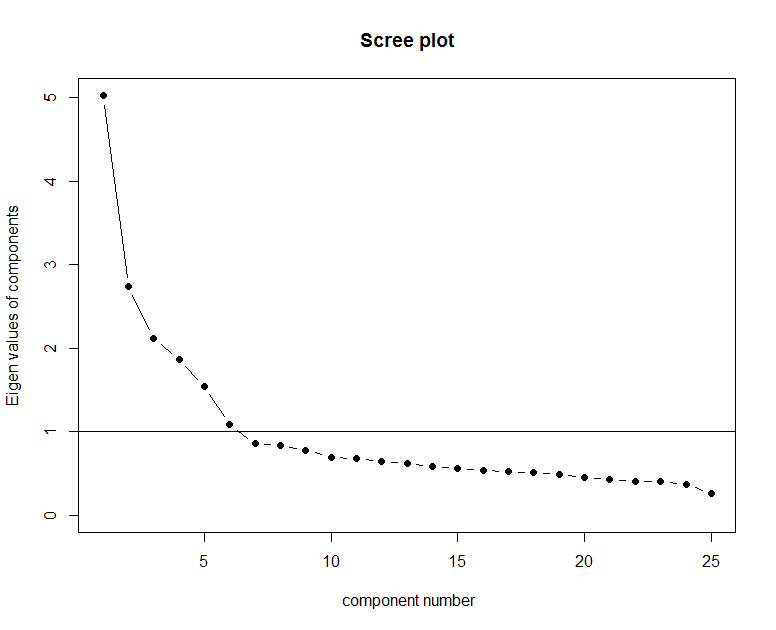
An empirical approach to dimensionality
Imagine we have no theory...

Without theory, use an empirical approach: Eigenvalues
Factor Analysis in R
Jennifer Brussow
Psychometrician
Imagine we have no theory...
Without theory, use an empirical approach: Eigenvalues

