Predictor insight graphs

Introduction to Predictive Analytics in Python

Nele Verbiest, Ph.D

Data Scientist @PythonPredictions

Motivation for predictor insight graphs

  1. Build model
  2. Evaluate model using AUC
  3. Evaluate model using cumulative gains and lift curves
  4. Verify whether the variables in the model are interpretable
Introduction to Predictive Analytics in Python

Interpretation of predictor insight graphs

Introduction to Predictive Analytics in Python

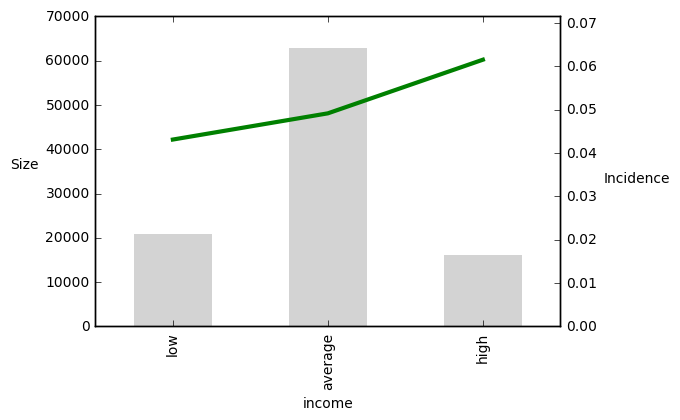
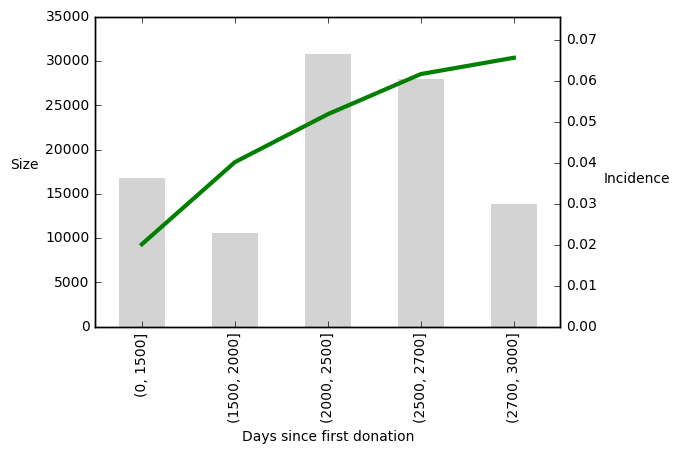
Predictor insight graphs for continuous variables

Introduction to Predictive Analytics in Python

The predictor insight graph table

Income Size Incidence
low 20850 0.0431
average 62950 0.0492
high 16200 0.0615


print(pig_table["Size"][income=="low"])
20850
Introduction to Predictive Analytics in Python

Constructing a predictor insight graph

  • (Discretisation of variable if continuous)
  • Calculate predictor insight graph table
  • Plot the predictor insight graph
Introduction to Predictive Analytics in Python

Let's practice!

Introduction to Predictive Analytics in Python

Preparing Video For Download...