Visualizing choice data

Choice Modeling for Marketing in R

Elea McDonnell Feit

Assistant Professor of Marketing, Drexel University

xtabs(~ trans, data = sportscar)
trans
  auto manual 
  3001   2999
xtabs(~ trans + choice, data = sportscar)
        choice
trans       0    1
  auto   1673 1328
  manual 2327  672
xtabs(choice ~ trans, data=sportscar)
trans
  auto manual 
  1328    672
Choice Modeling for Marketing in R

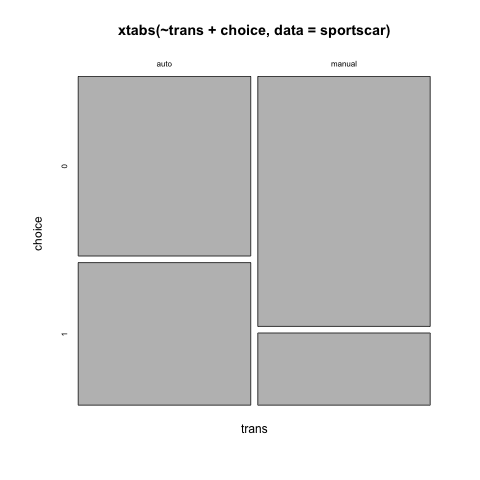
Plotting the output of xtabs()

plot(xtabs(~ trans + choice, data = sportscar))

Trans choice counts

Choice Modeling for Marketing in R

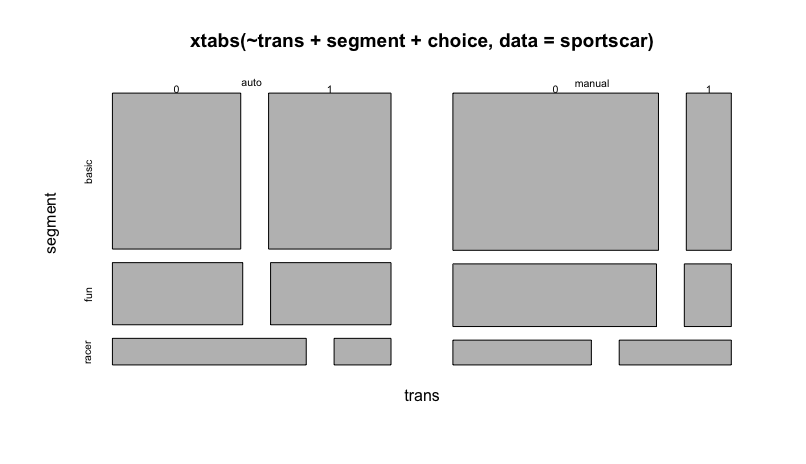
Transmission choice by segment

plot(xtabs(~ trans + segment + choice, data = sportscar))

Trans segment choice counts

Choice Modeling for Marketing in R

Let's practice!

Choice Modeling for Marketing in R

Preparing Video For Download...