Recreating the plot

Categorical Data in the Tidyverse

Emily Robinson

Data Scientist

Labs

ggplot(mtcars, aes(disp, mpg)) + geom_point() + 
  labs(x = "x axis label", y = "y axis label", title = "My title", 
       subtitle = "and a subtitle", caption = "even a caption!")
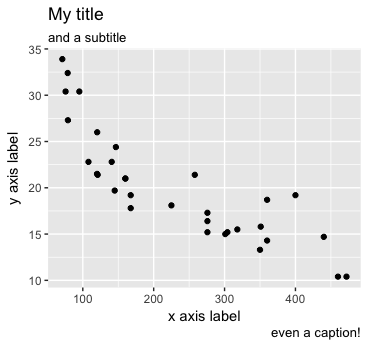
A scatterplot with the title "My title", subtitle "and a subtitle", y-axis label "y axis label",  x-axis label "x axis label", and caption "even a caption!"

Categorical Data in the Tidyverse

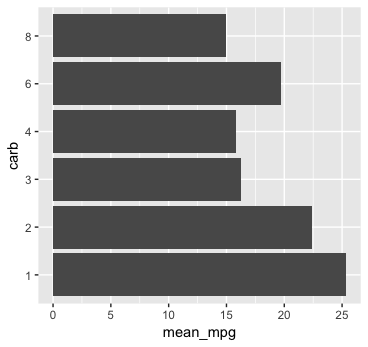
A bar chart with x-axis "mean mpg" and y-axis "carb".

Categorical Data in the Tidyverse

Geom_text

initial_plot + geom_text(aes(label = round(mean_mpg)))
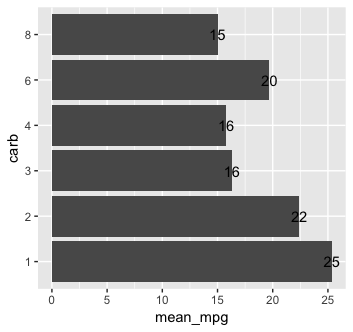
The same bar chart but with the mean mpg number overlapping the top of each bar.

Categorical Data in the Tidyverse

Moving text

initial_plot + 
  geom_text(aes(label = round(mean_mpg), y = mean_mpg + 2))
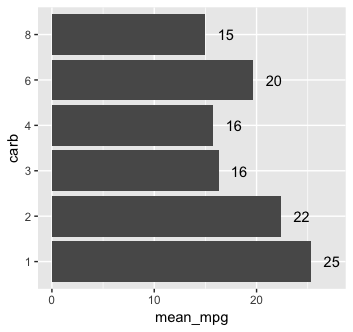
The same graph as before but now the text is above each bar.

Categorical Data in the Tidyverse

Theme

initial_plot + 
  geom_text(aes(label = round(mean_mpg), y = mean_mpg + 2)) + 
  theme(axis.text.x = element_blank(), axis.ticks.x = element_blank())
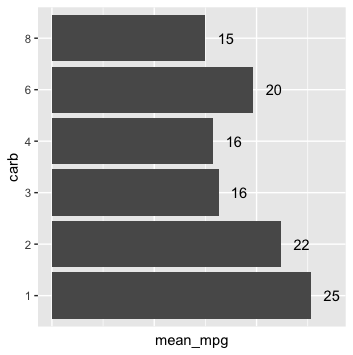
The same graph as before but now without an x-axis label or tick marks.

Categorical Data in the Tidyverse

Let's practice!

Categorical Data in the Tidyverse

Preparing Video For Download...