Multivariate t-distributions
Multivariate Probability Distributions in R

Surajit Ray
Professor, University of Glasgow
Comparing univariate normal with univariate t-distributions
Comparing normal and t-distribution tails
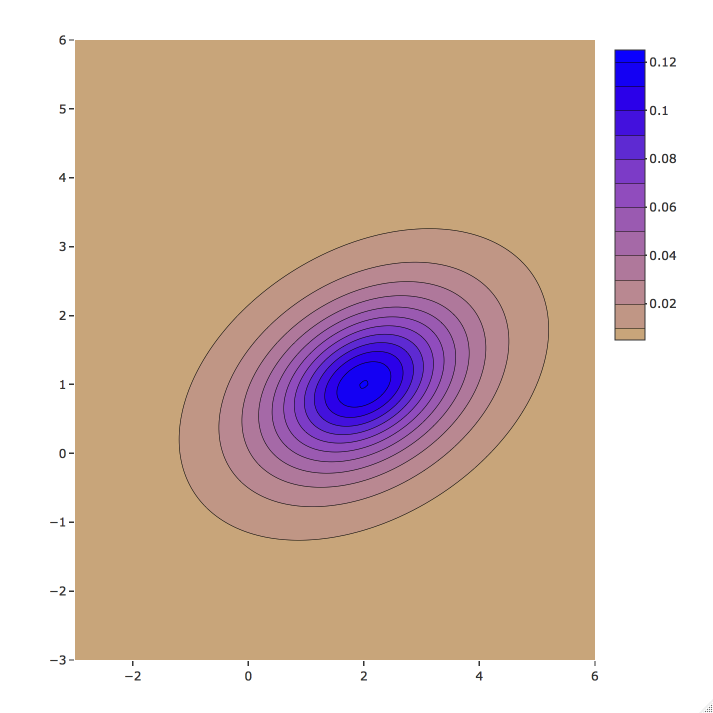
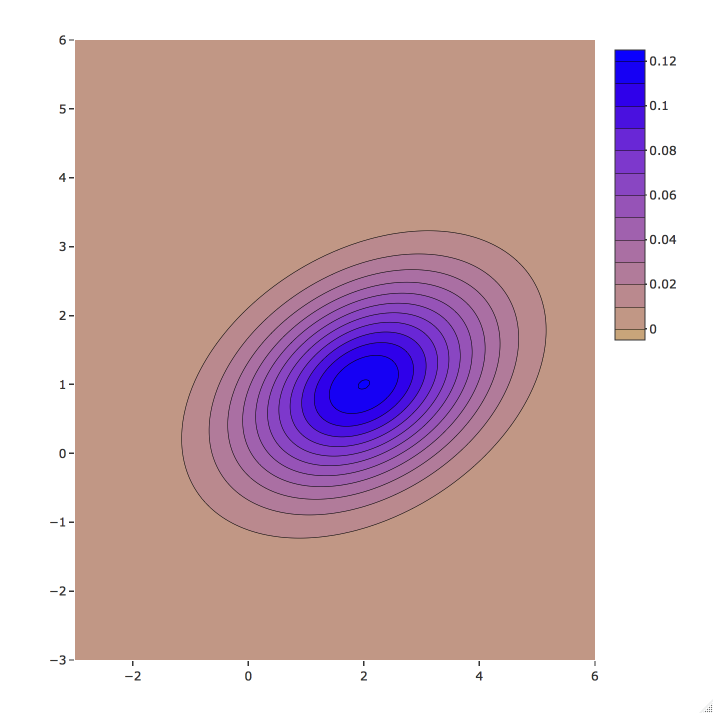
Contours of bivariate normal and t-distributions
${\mu}=\delta={\begin{pmatrix} 1 \\ 2 \end{pmatrix}},\quad { \Sigma }={\begin{pmatrix} 1 & 0.5 \\ 0.5 & 2 \end{pmatrix}}$
Contours of a t with df = 3
${\begin{matrix} ~ \\ ~ \end{matrix}}$
Contours of a bivariate normal
Comparing with normal samples
t-distribution with 4 degrees of freedom
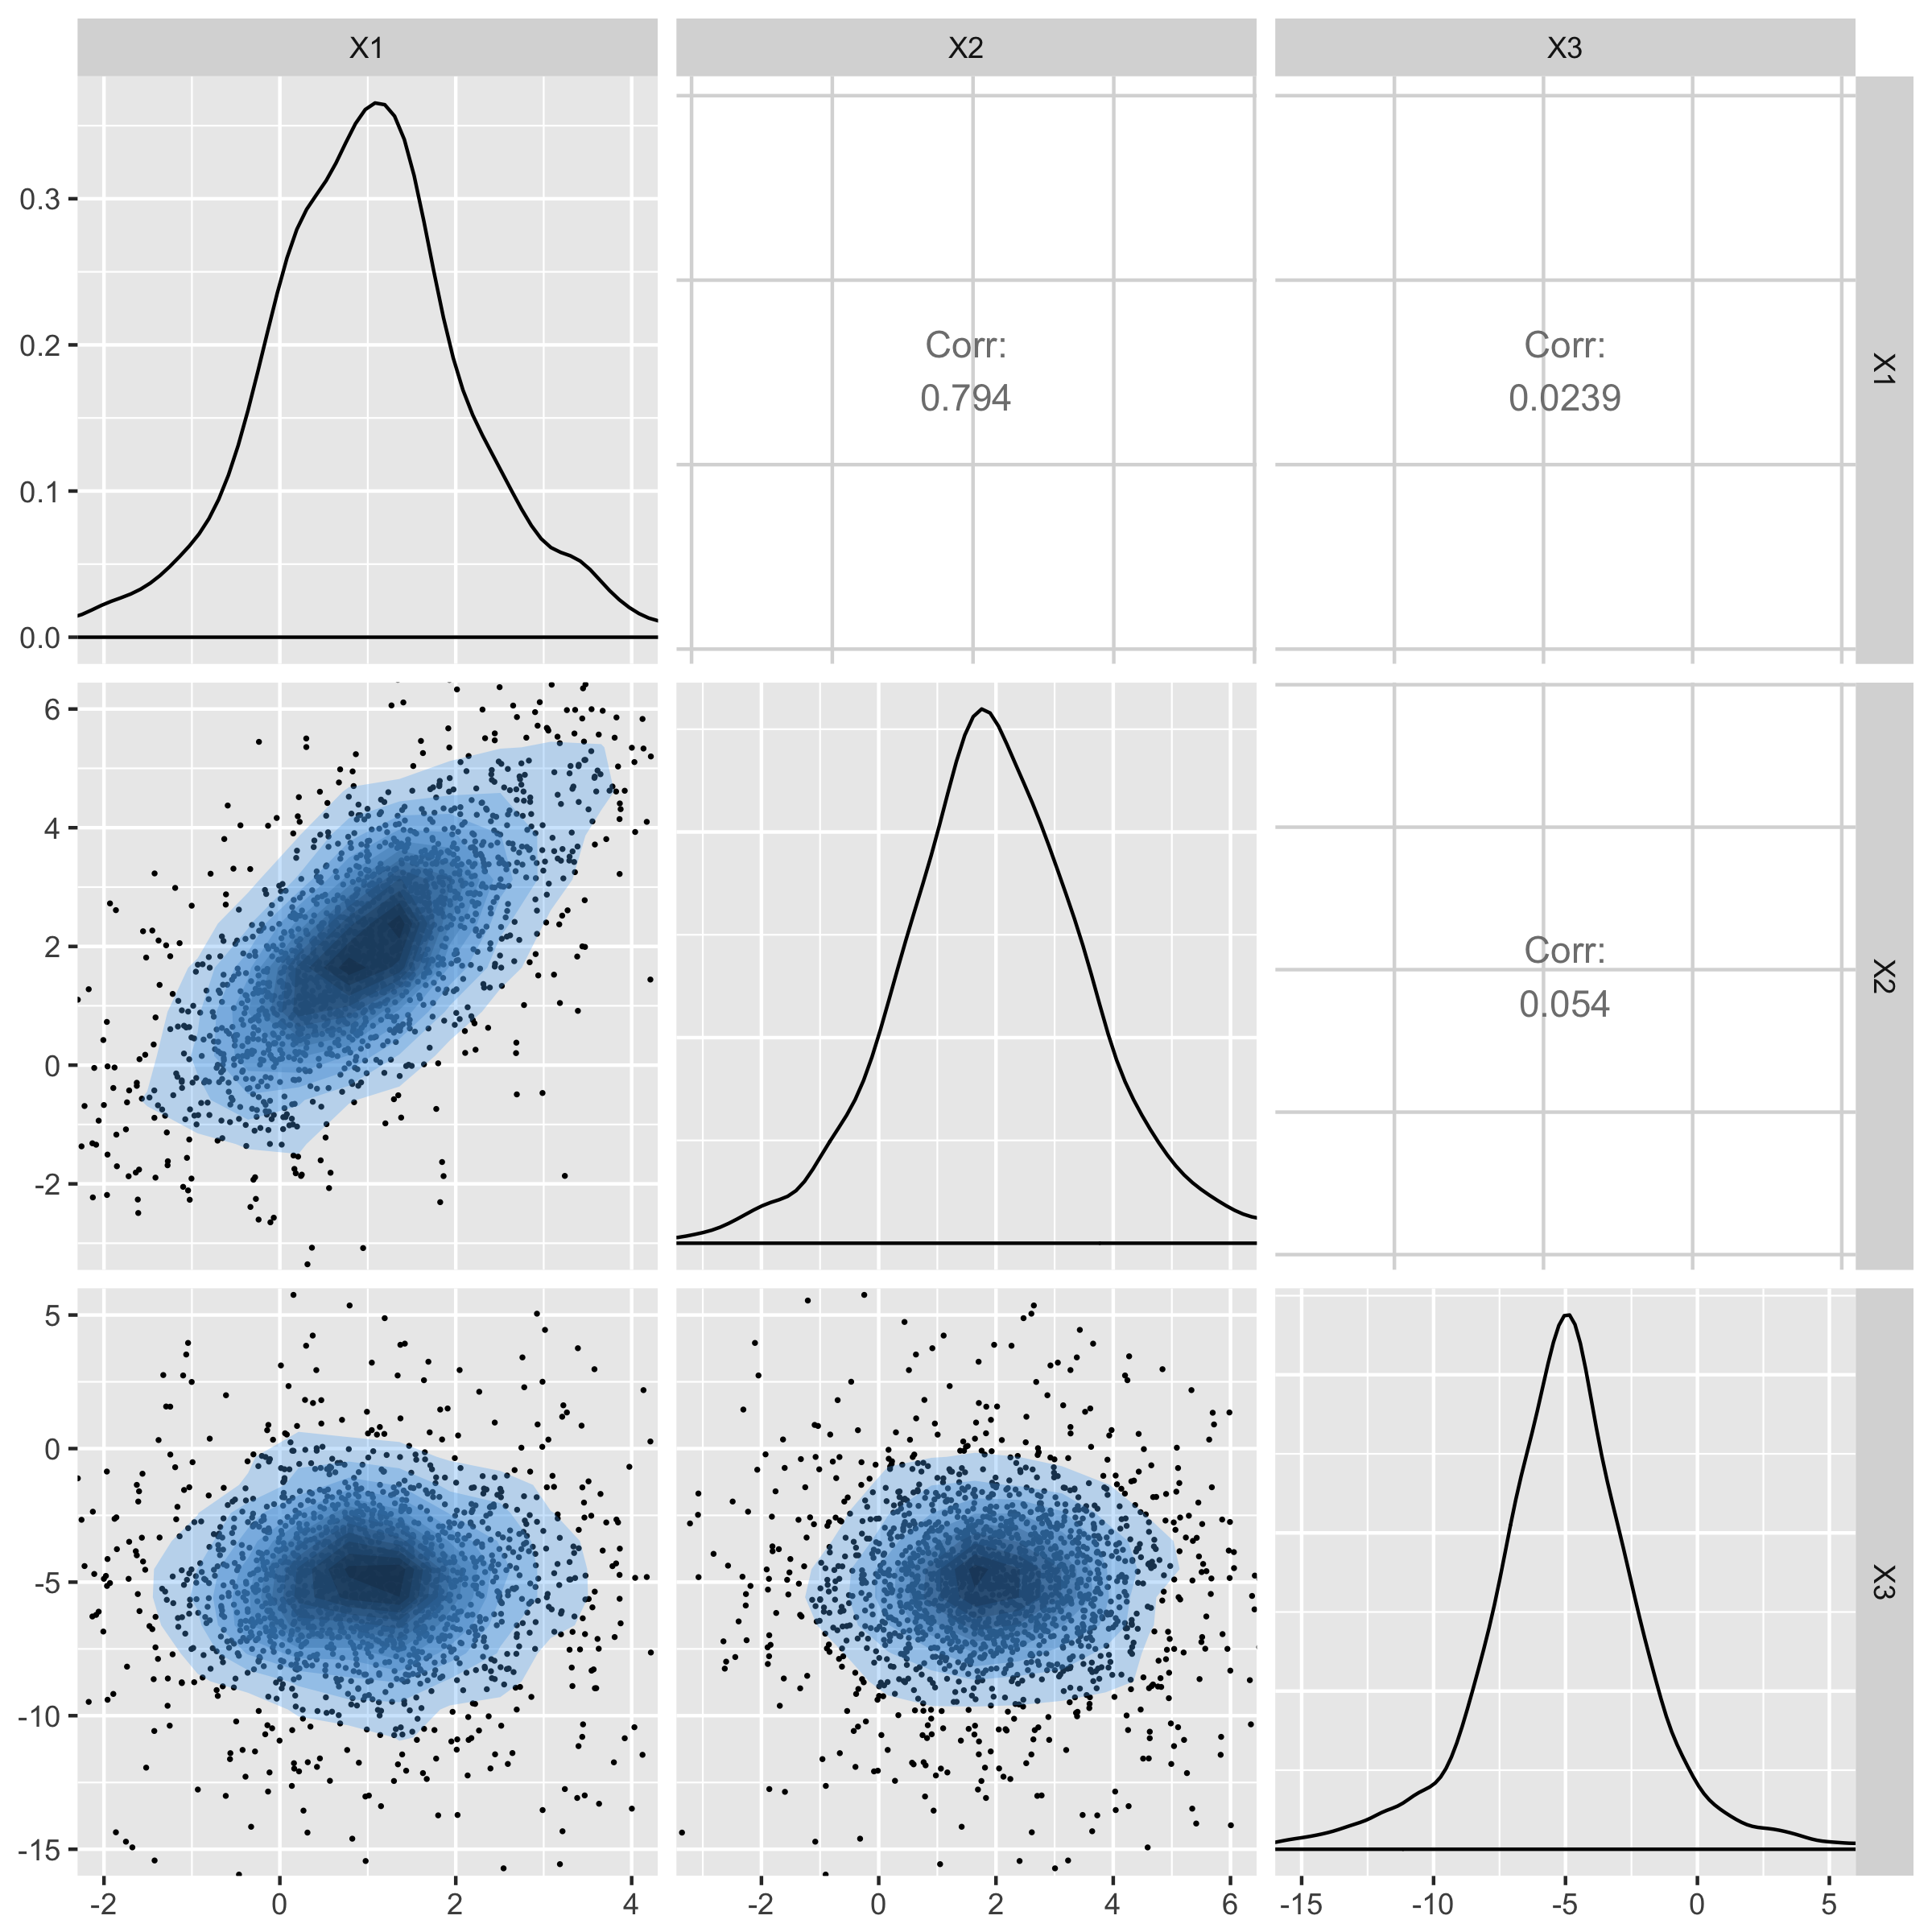
Normal distribution
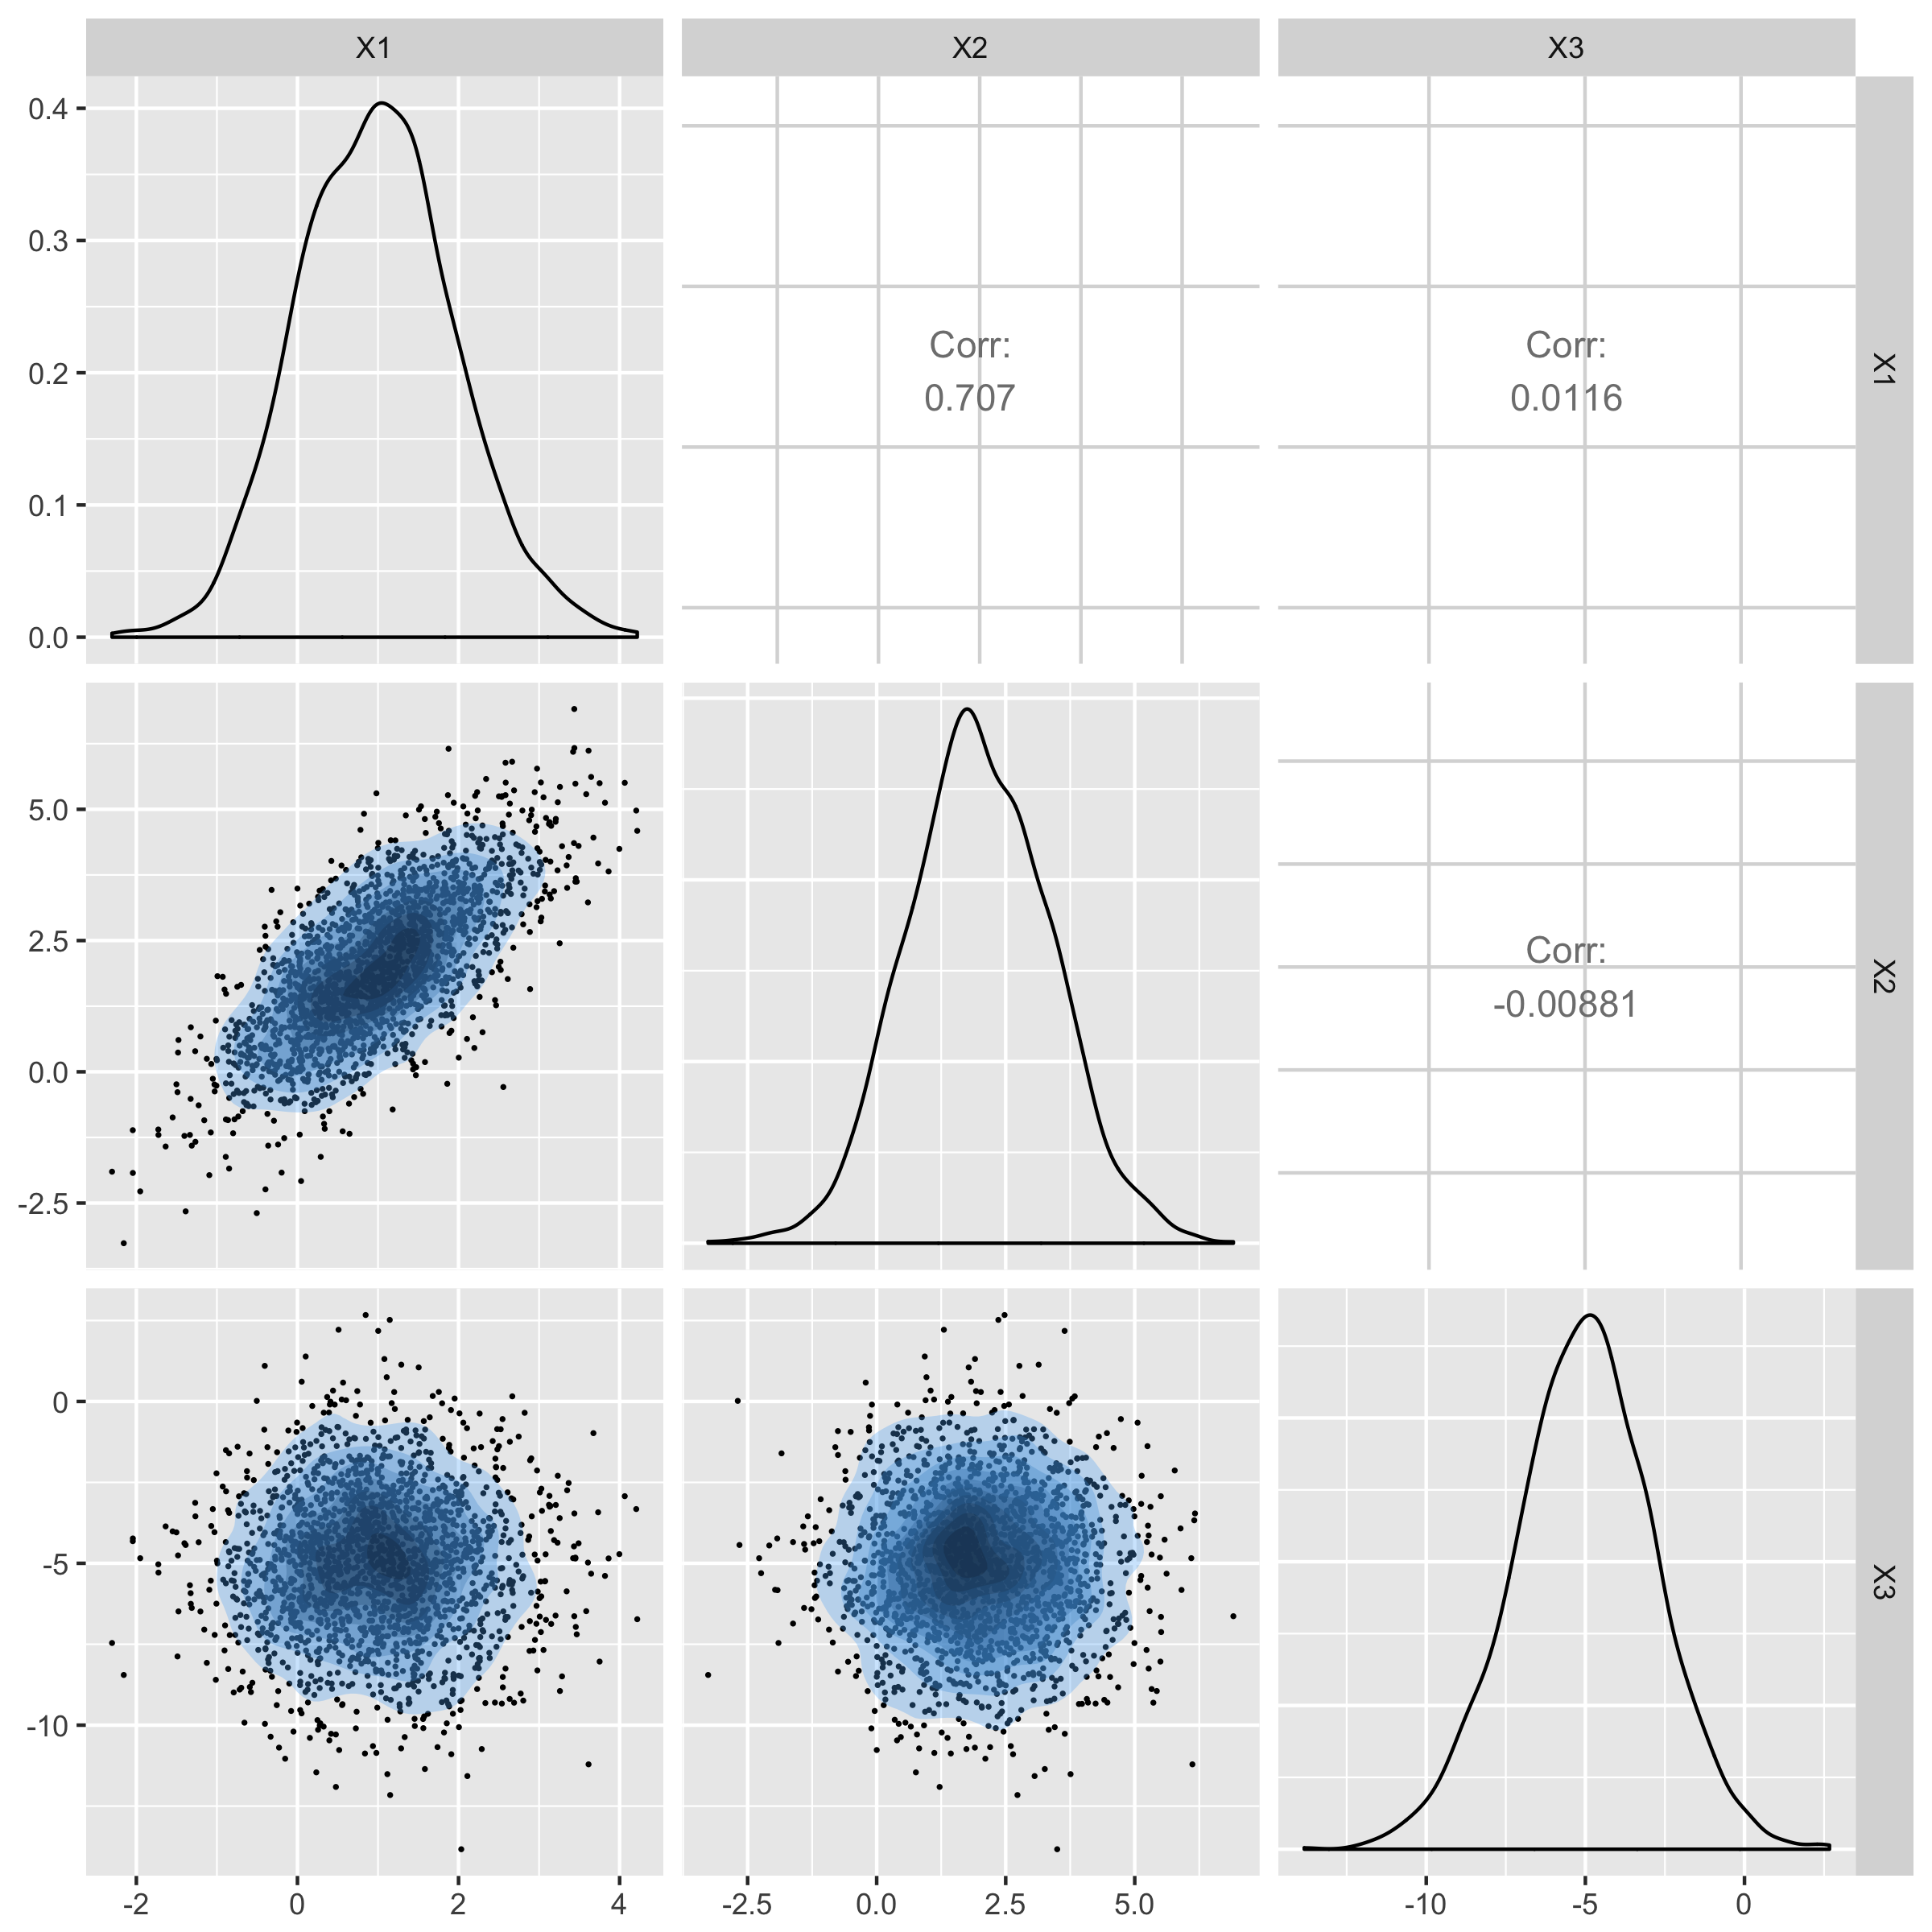
Comparing with normal samples
t-distribution with 10 degrees of freedom
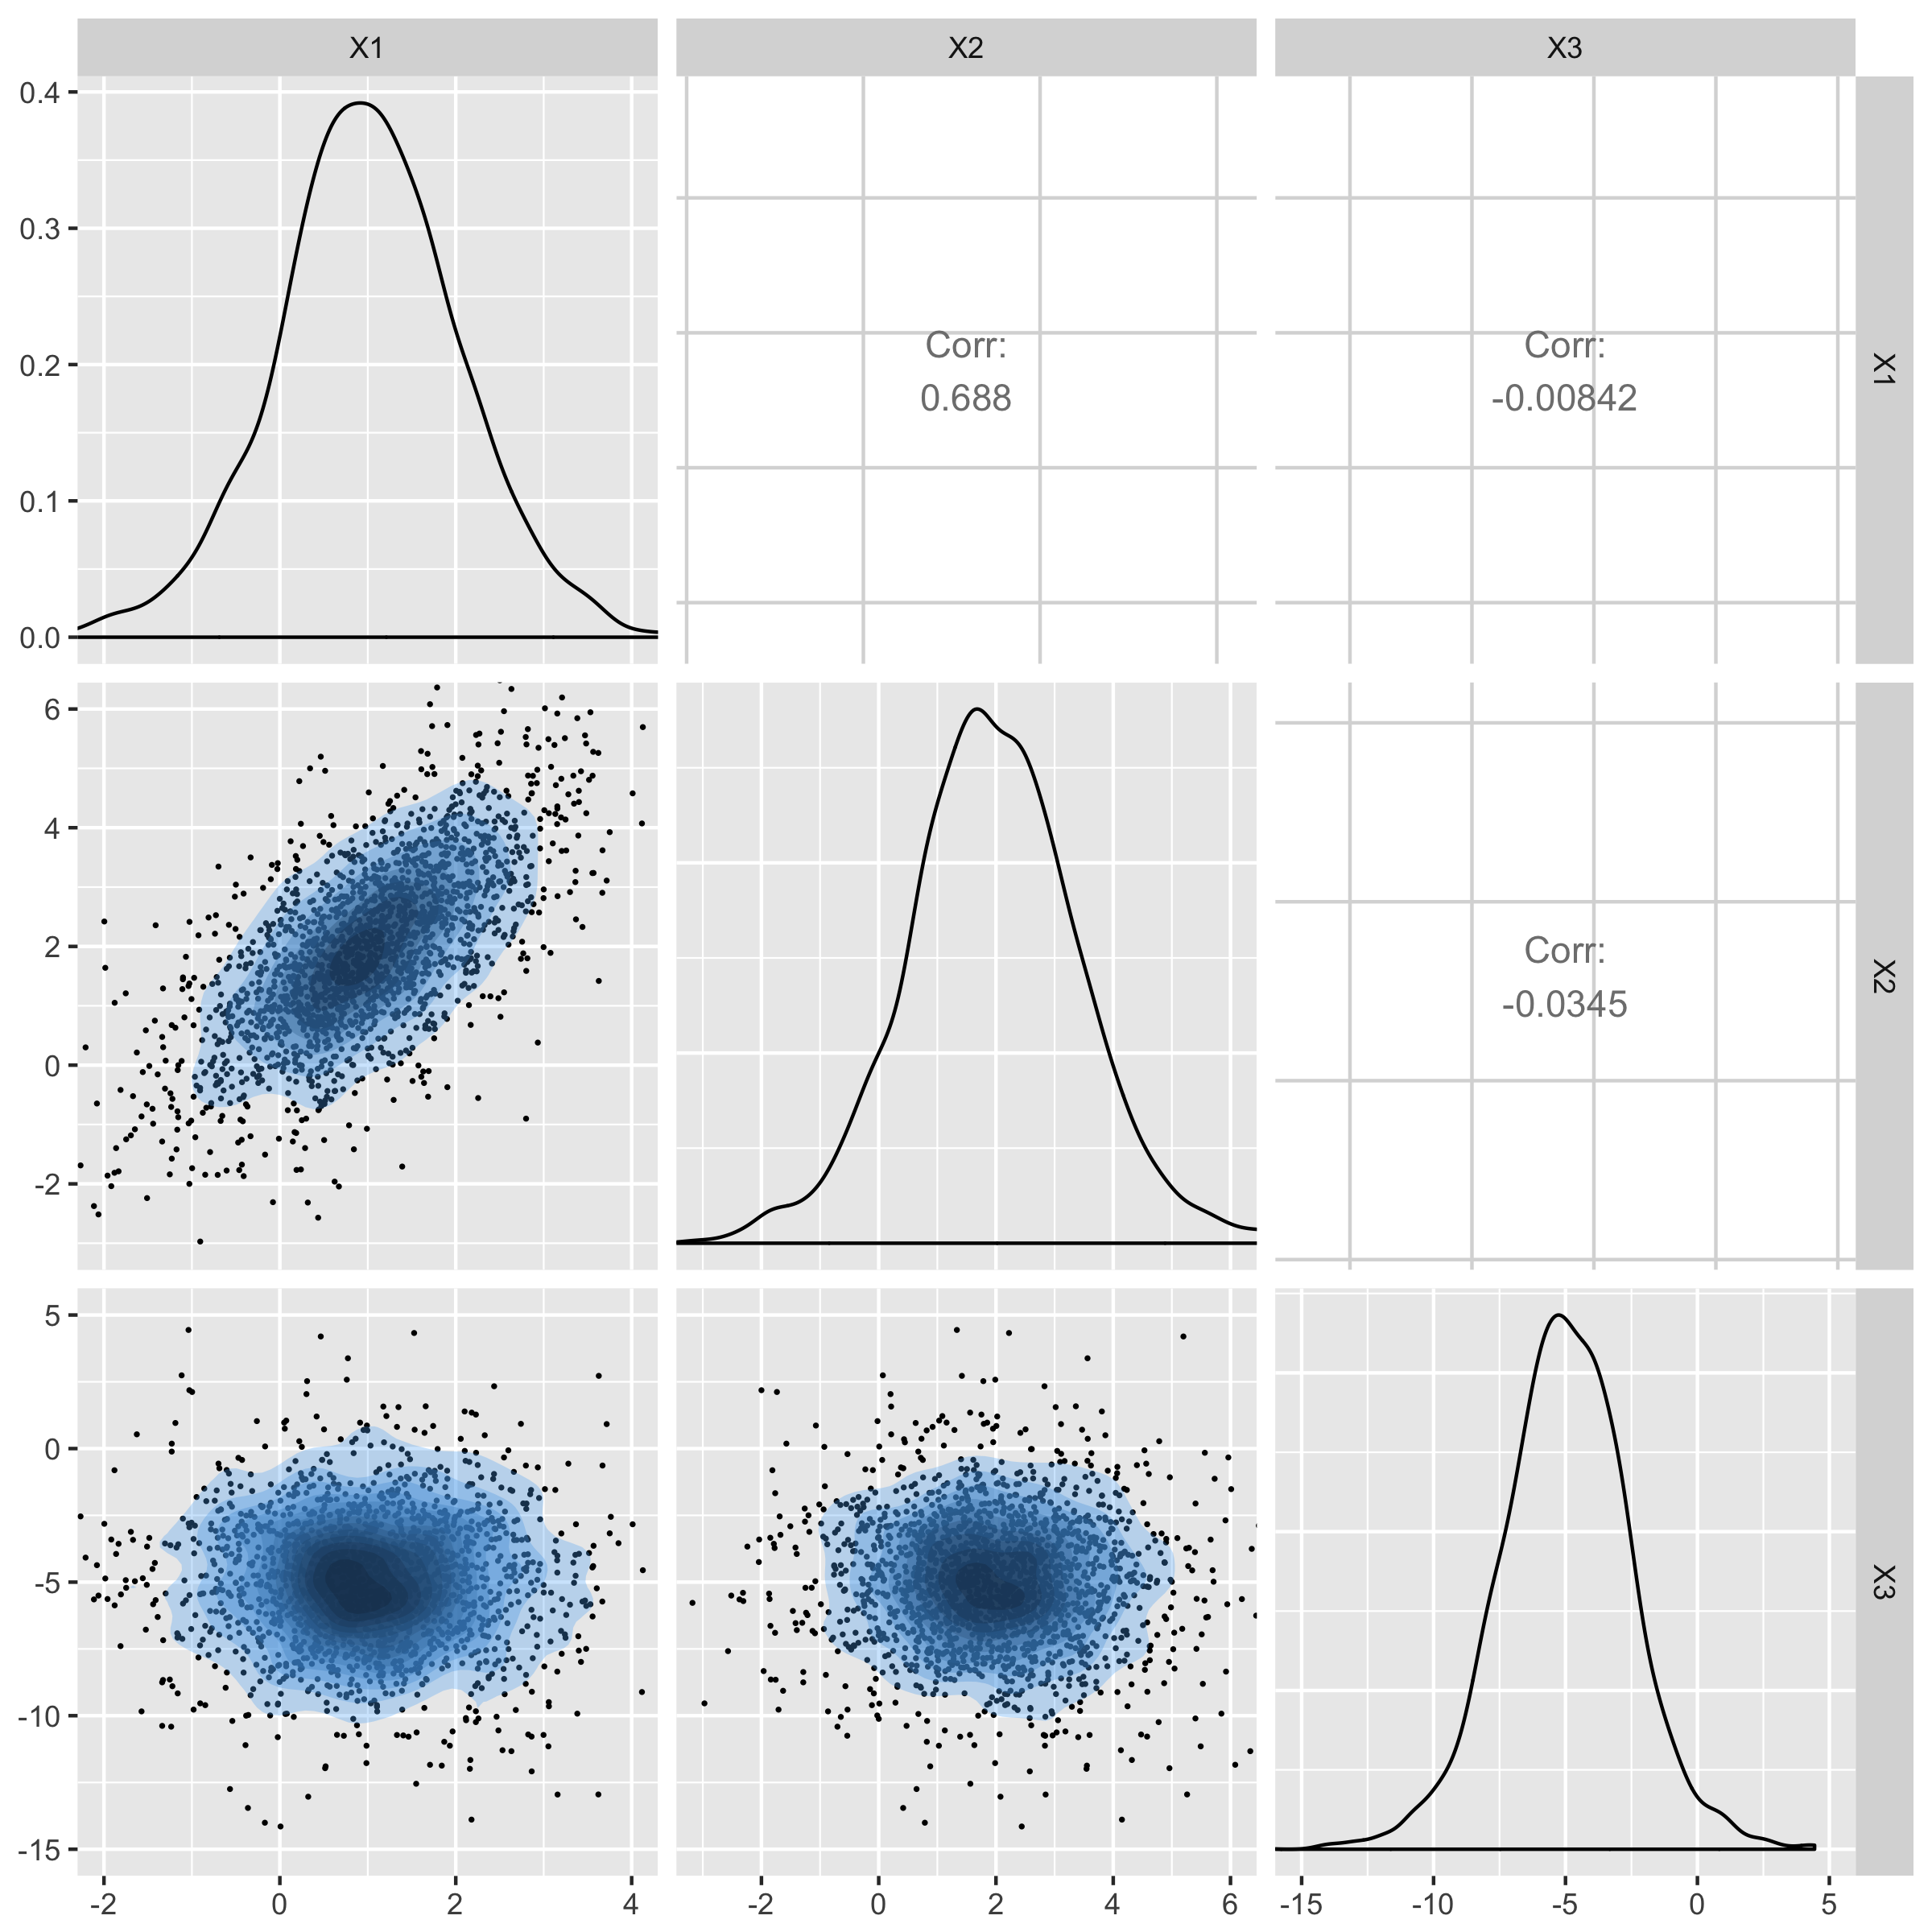
Normal distribution

