Density of a multivariate normal distribution
Multivariate Probability Distributions in R

Surajit Ray
Professor, University of Glasgow
Why calculate the density of a distribution?

Why calculate the density of a distribution?
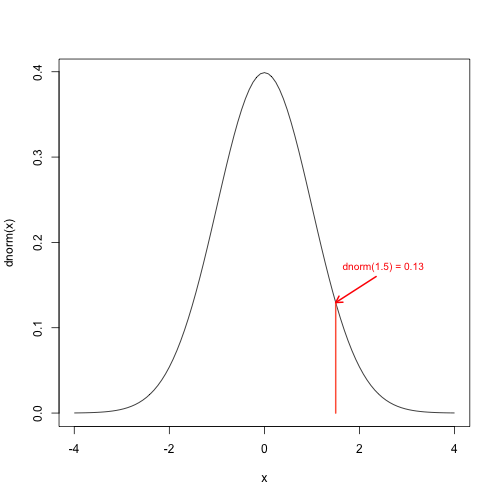
Univariate normal functions dnorm()
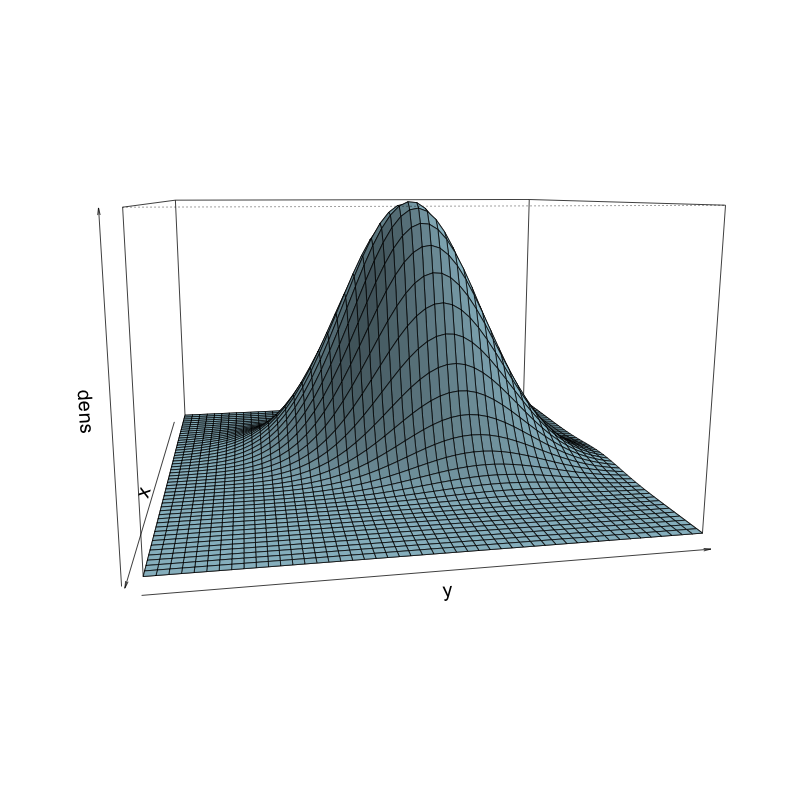
Probability density of a bivariate normal
Standard bivariate normal with $$ \mu = \begin{pmatrix} 0 \\ 0 \end{pmatrix} , \Sigma = \begin{pmatrix} 1 & 0 \\ 0 & 1 \end{pmatrix} $$
dmvnorm() function
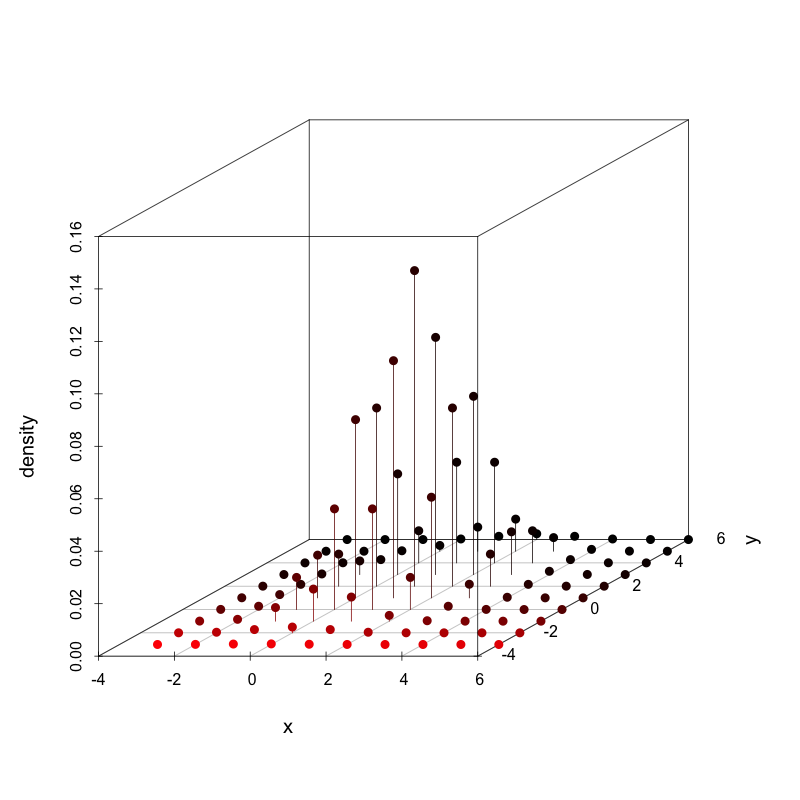
Density heights calculated at several locations (xy coordinates)
Plotting bivariate densities with perspective plot
Plotting bivariate densities with perspective plot
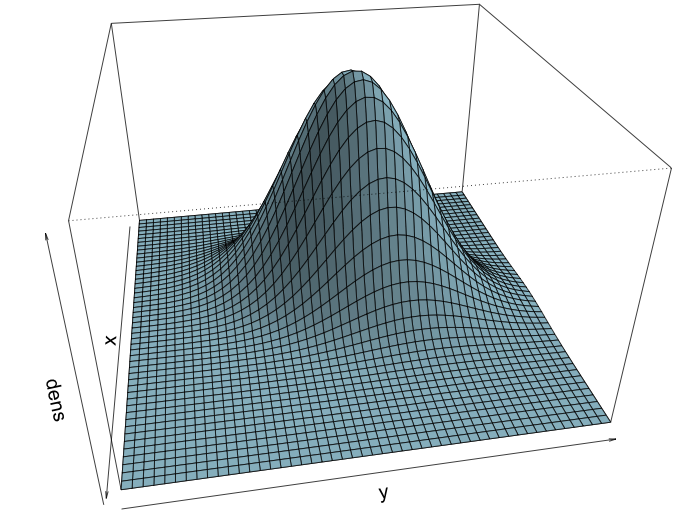
Changing viewing angle in perspective plot
persp() with theta = 30, phi = 30
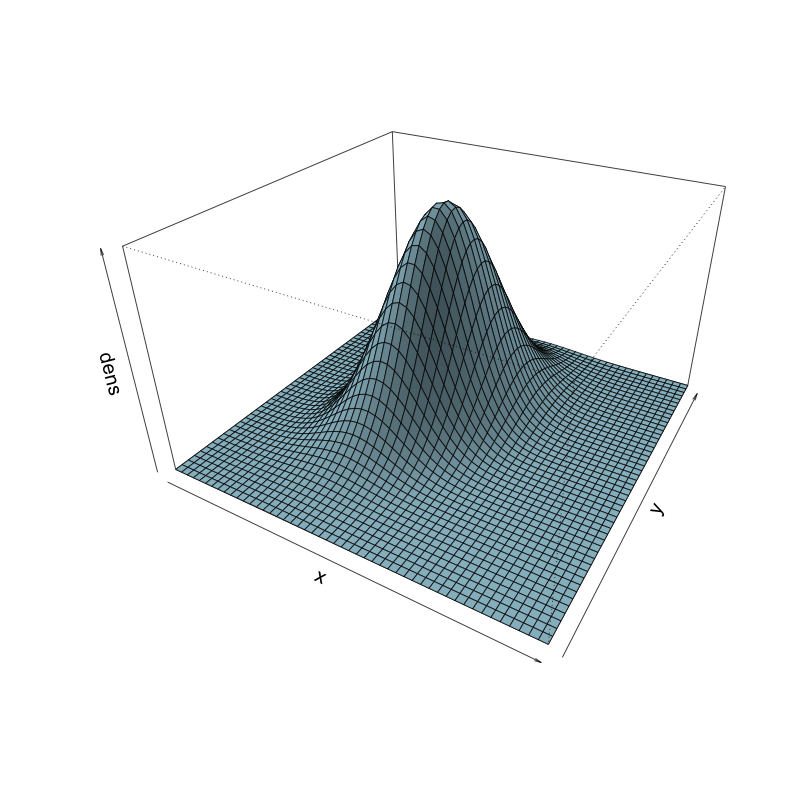
persp() with theta = 80, phi = 10