Principal Component Analysis
Multivariate Probability Distributions in R

Surajit Ray
Professor, University of Glasgow
Principal Component Analysis (PCA) goals
- Dimension reduction
- Creating uncorrelated variables
- Capturing variability in fewer dimensions
Algorithm
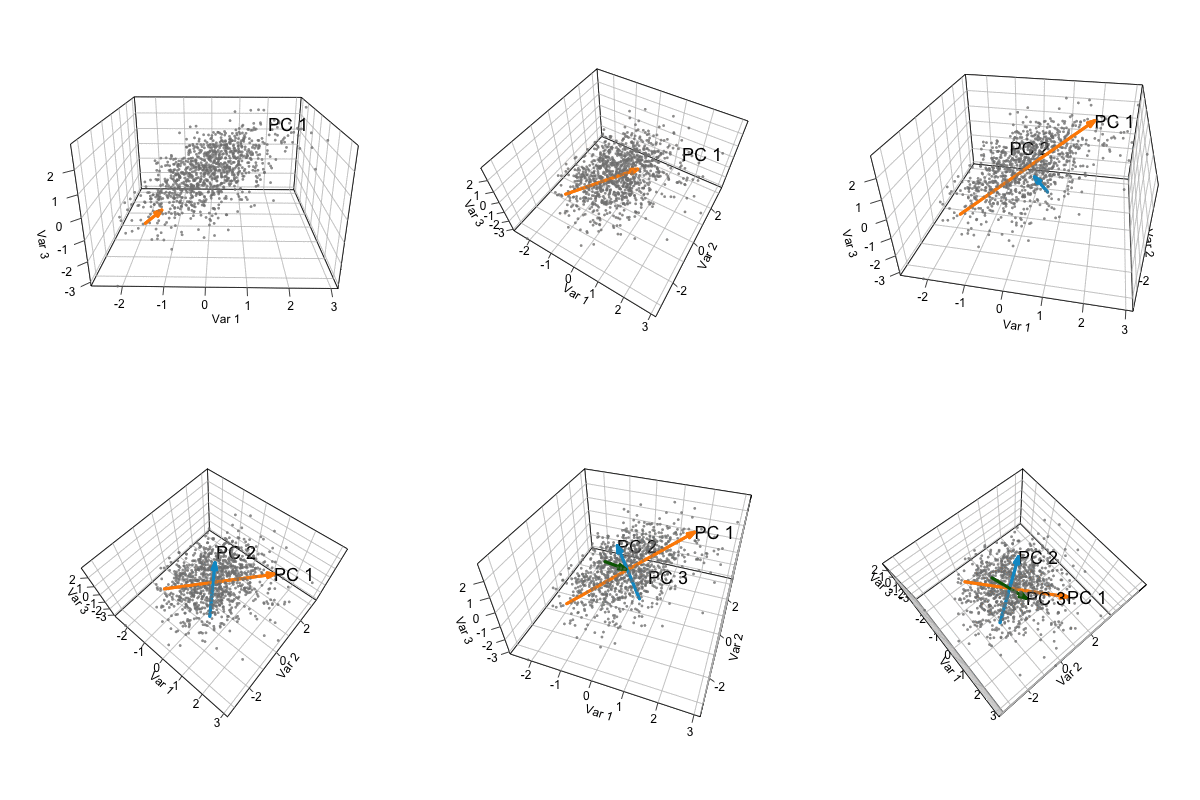
- PC1 explains maximum variation in orange direction
- PC2 uncorrelated to PC1 - explains maximum remaining variation in blue direction
- PC3 uncorrelated to PC1 and PC2 - explains maximum remaining variation in green direction
princomp() function calculates PCs

Principal Component Analysis in R
Simplified format
princomp(x, cor = FALSE, scores = TRUE)
x: a numeric matrix or data frame
cor: use correlation matrix instead of covariance
scores: scores/projection of the data on principal components are produced
Principal Component Analysis of mtcars dataset
mtcars dataset relates to 11 variables on fuel consumption for 32 automobiles
head(mtcars,5)
                     mpg cyl  disp  hp drat    wt  qsec vs am gear carb
Mazda RX4           21.0   6 160.0 110 3.90 2.620 16.46  0  1    4    4
Mazda RX4 Wag       21.0   6 160.0 110 3.90 2.875 17.02  0  1    4    4
Datsun 710          22.8   4 108.0  93 3.85 2.320 18.61  1  1    4    1
Hornet 4 Drive      21.4   6 258.0 110 3.08 3.215 19.44  1  0    3    1
Hornet Sportabout   18.7   8 360.0 175 3.15 3.440 17.02  0  0    3    2
Selecting numeric columns from mtcars dataset
- Exclude the
vsandamvariables - both binary
$$mtcars.sub <- mtcars[ , -c(8,9)] - Perform PCA
cars.pca <- princomp(mtcars.sub, cor = TRUE, scores = TRUE)
princomp function output
cars.pca
Standard deviations:
Comp.1 Comp.2 Comp.3 Comp.4 Comp.5 Comp.6 Comp.7 Comp.8 Comp.9
 2.378  1.443  0.710  0.515  0.428  0.352  0.324  0.242  0.149
summary(cars.pca)
Importance of components:
                       Comp.1 Comp.2 Comp.3 Comp.4 Comp.5 Comp.6 Comp.7 Comp.8  Comp.9
Standard deviation      2.378  1.443  0.710 0.5148 0.4280 0.3518 0.3241 0.2419 0.14896
Proportion of Variance  0.628  0.231  0.056 0.0294 0.0204 0.0138 0.0117 0.0065 0.00247
Cumulative Proportion   0.628  0.860  0.916 0.9453 0.9656 0.9794 0.9910 0.9975 1.00000
Let's apply principal component analysis!
Multivariate Probability Distributions in R

