Multivariate Probability Distributions in R
Surajit Ray
Reader, University of Glasgow
pmvt()
qmvt()
dmvt(x, delta = rep(0, p), sigma = diag(p), log = TRUE)
x
can be a vector or a matrixdmvnorm
the default calculation is in log scaleTo get the densities in natural scale use
dmvt(x, delta = rep(0, p), sigma = diag(p), log = FALSE)
Calculating the density of a multivariate t-distribution on a grid
x <- seq(-3, 6, by = 1); y <- seq(-3, 6, by = 1)
d <- expand.grid(x = x, y = x)
del1 <- c(1, 2); sig1 <- matrix(c(1, .5, .5, 2), 2)
dens <- dmvt(as.matrix(d), delta = del1, sigma = sig1, df = 10, log = FALSE)
scatterplot3d(cbind(d, dens), type = "h", zlab = "density")
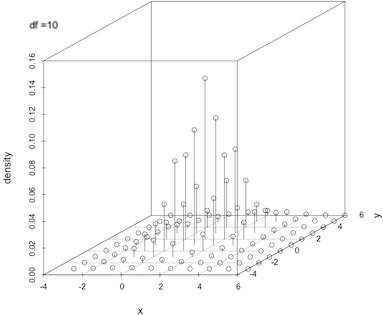
Effect of changing the degees of freedom
pmvt(lower = -Inf, upper = Inf, delta, sigma, df, ...)
pmvnorm()
functionpmvt(lower = c(-1, -2), upper = c(2, 2), delta = c(1, 2), sigma = diag(2), df = 6)
[1] 0.3857
attr(,"error")
[1] 0.0002542
attr(,"msg")
[1] "Normal Completion"
qmvt(p, interval, tail, delta, sigma, df)
qmvnorm()
function Calculate the 0.95 quantile for 3 degrees of freedom
qmvt( p = 0.95, sigma = diag(2), tail = "both", df = 3)
$quantile
[1] 3.96
$f.quantile
[1] -1.05e-06
attr(,"message")
[1] "Normal Completion"
Multivariate Probability Distributions in R