Multivariate normal distribution
Multivariate Probability Distributions in R

Surajit Ray
Professor, University of Glasgow
Univariate normal distribution
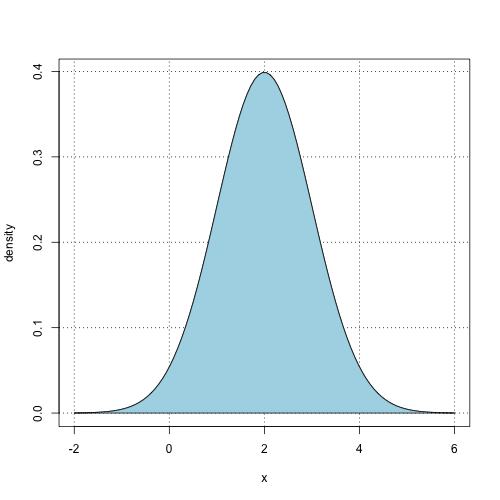 Univariate normal with mean 2 and variance 1
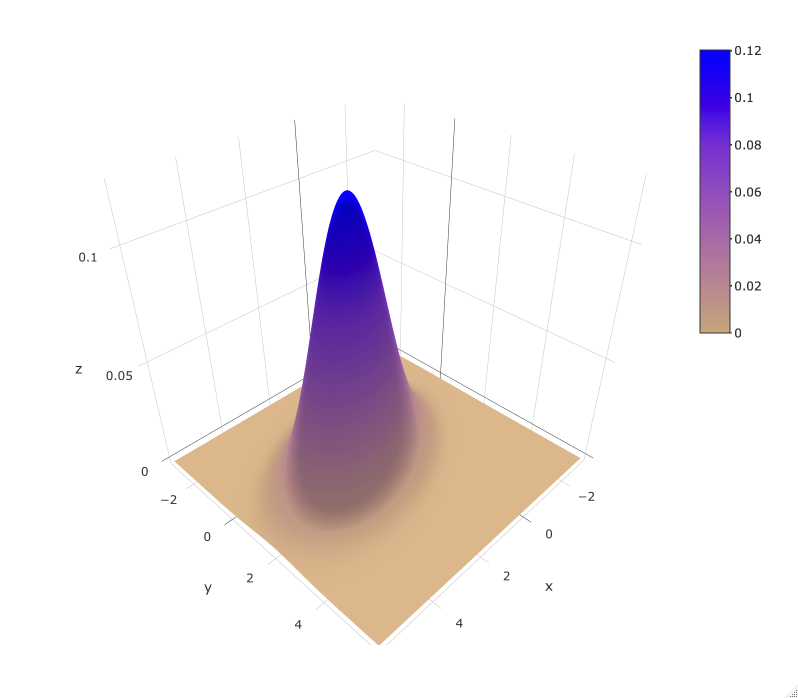
Density shape of a bivariate normal
Bivariate normal density - 3D density plot
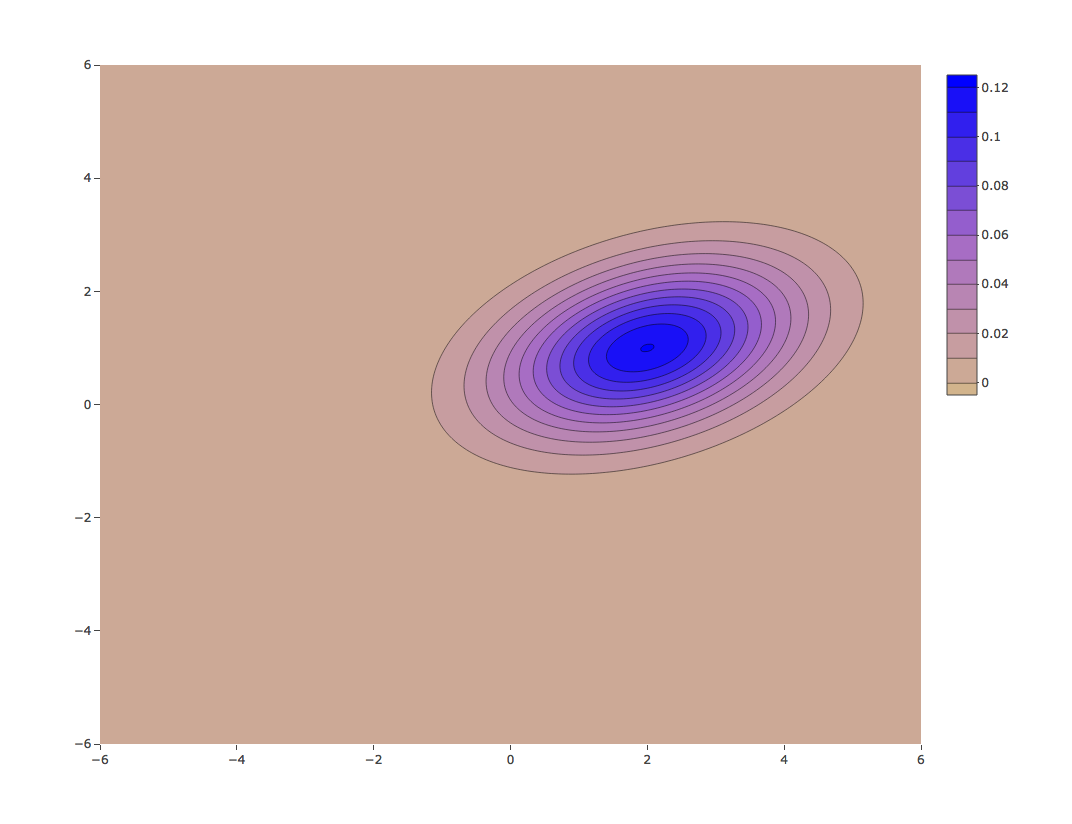
Bivariate normal density - contour plot
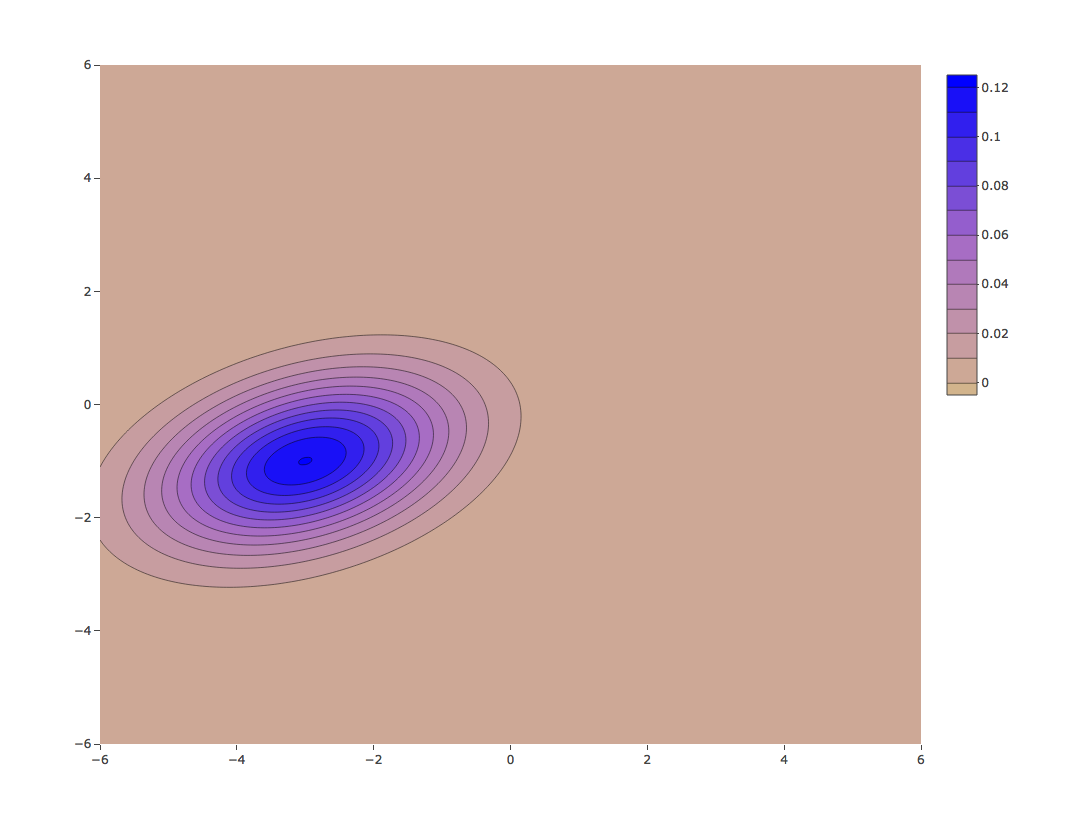
Bivariate normal density with a different mean
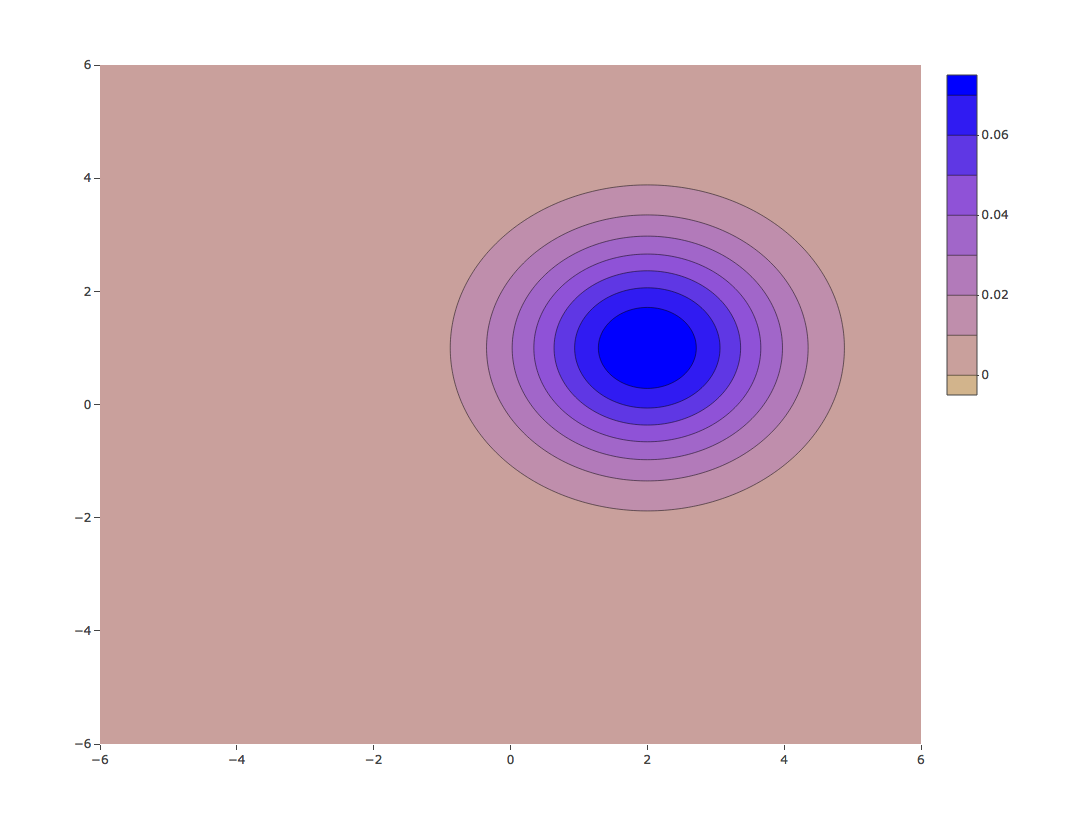
Bivariate normal density with a different variance
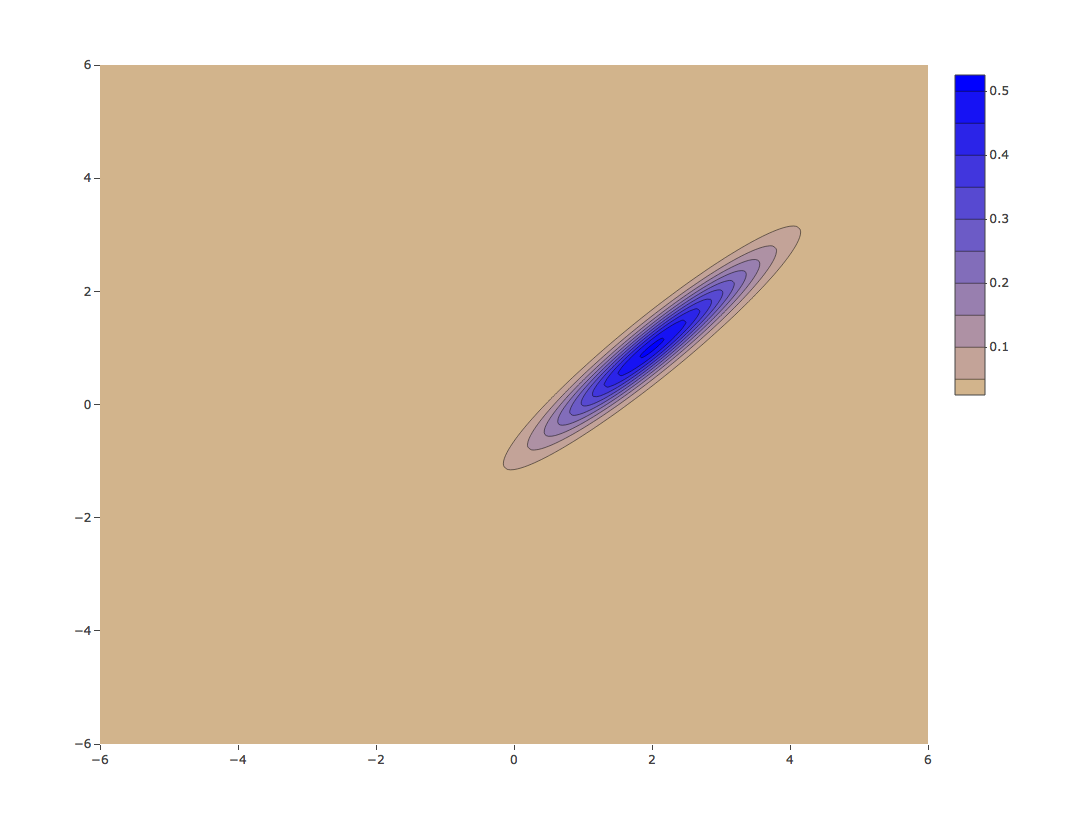
Bivariate normal density with strong correlation
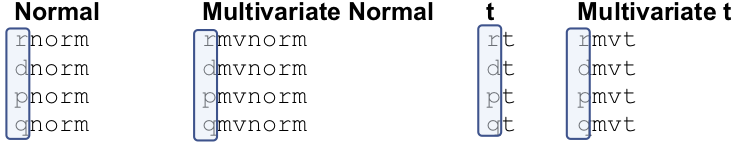
Functions for statistical distributions in R
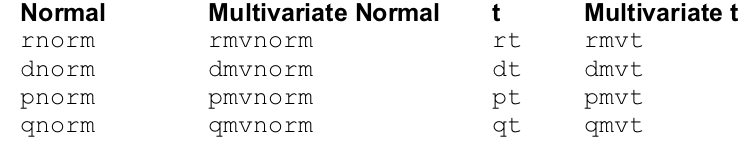
Functions for statistical distributions in R
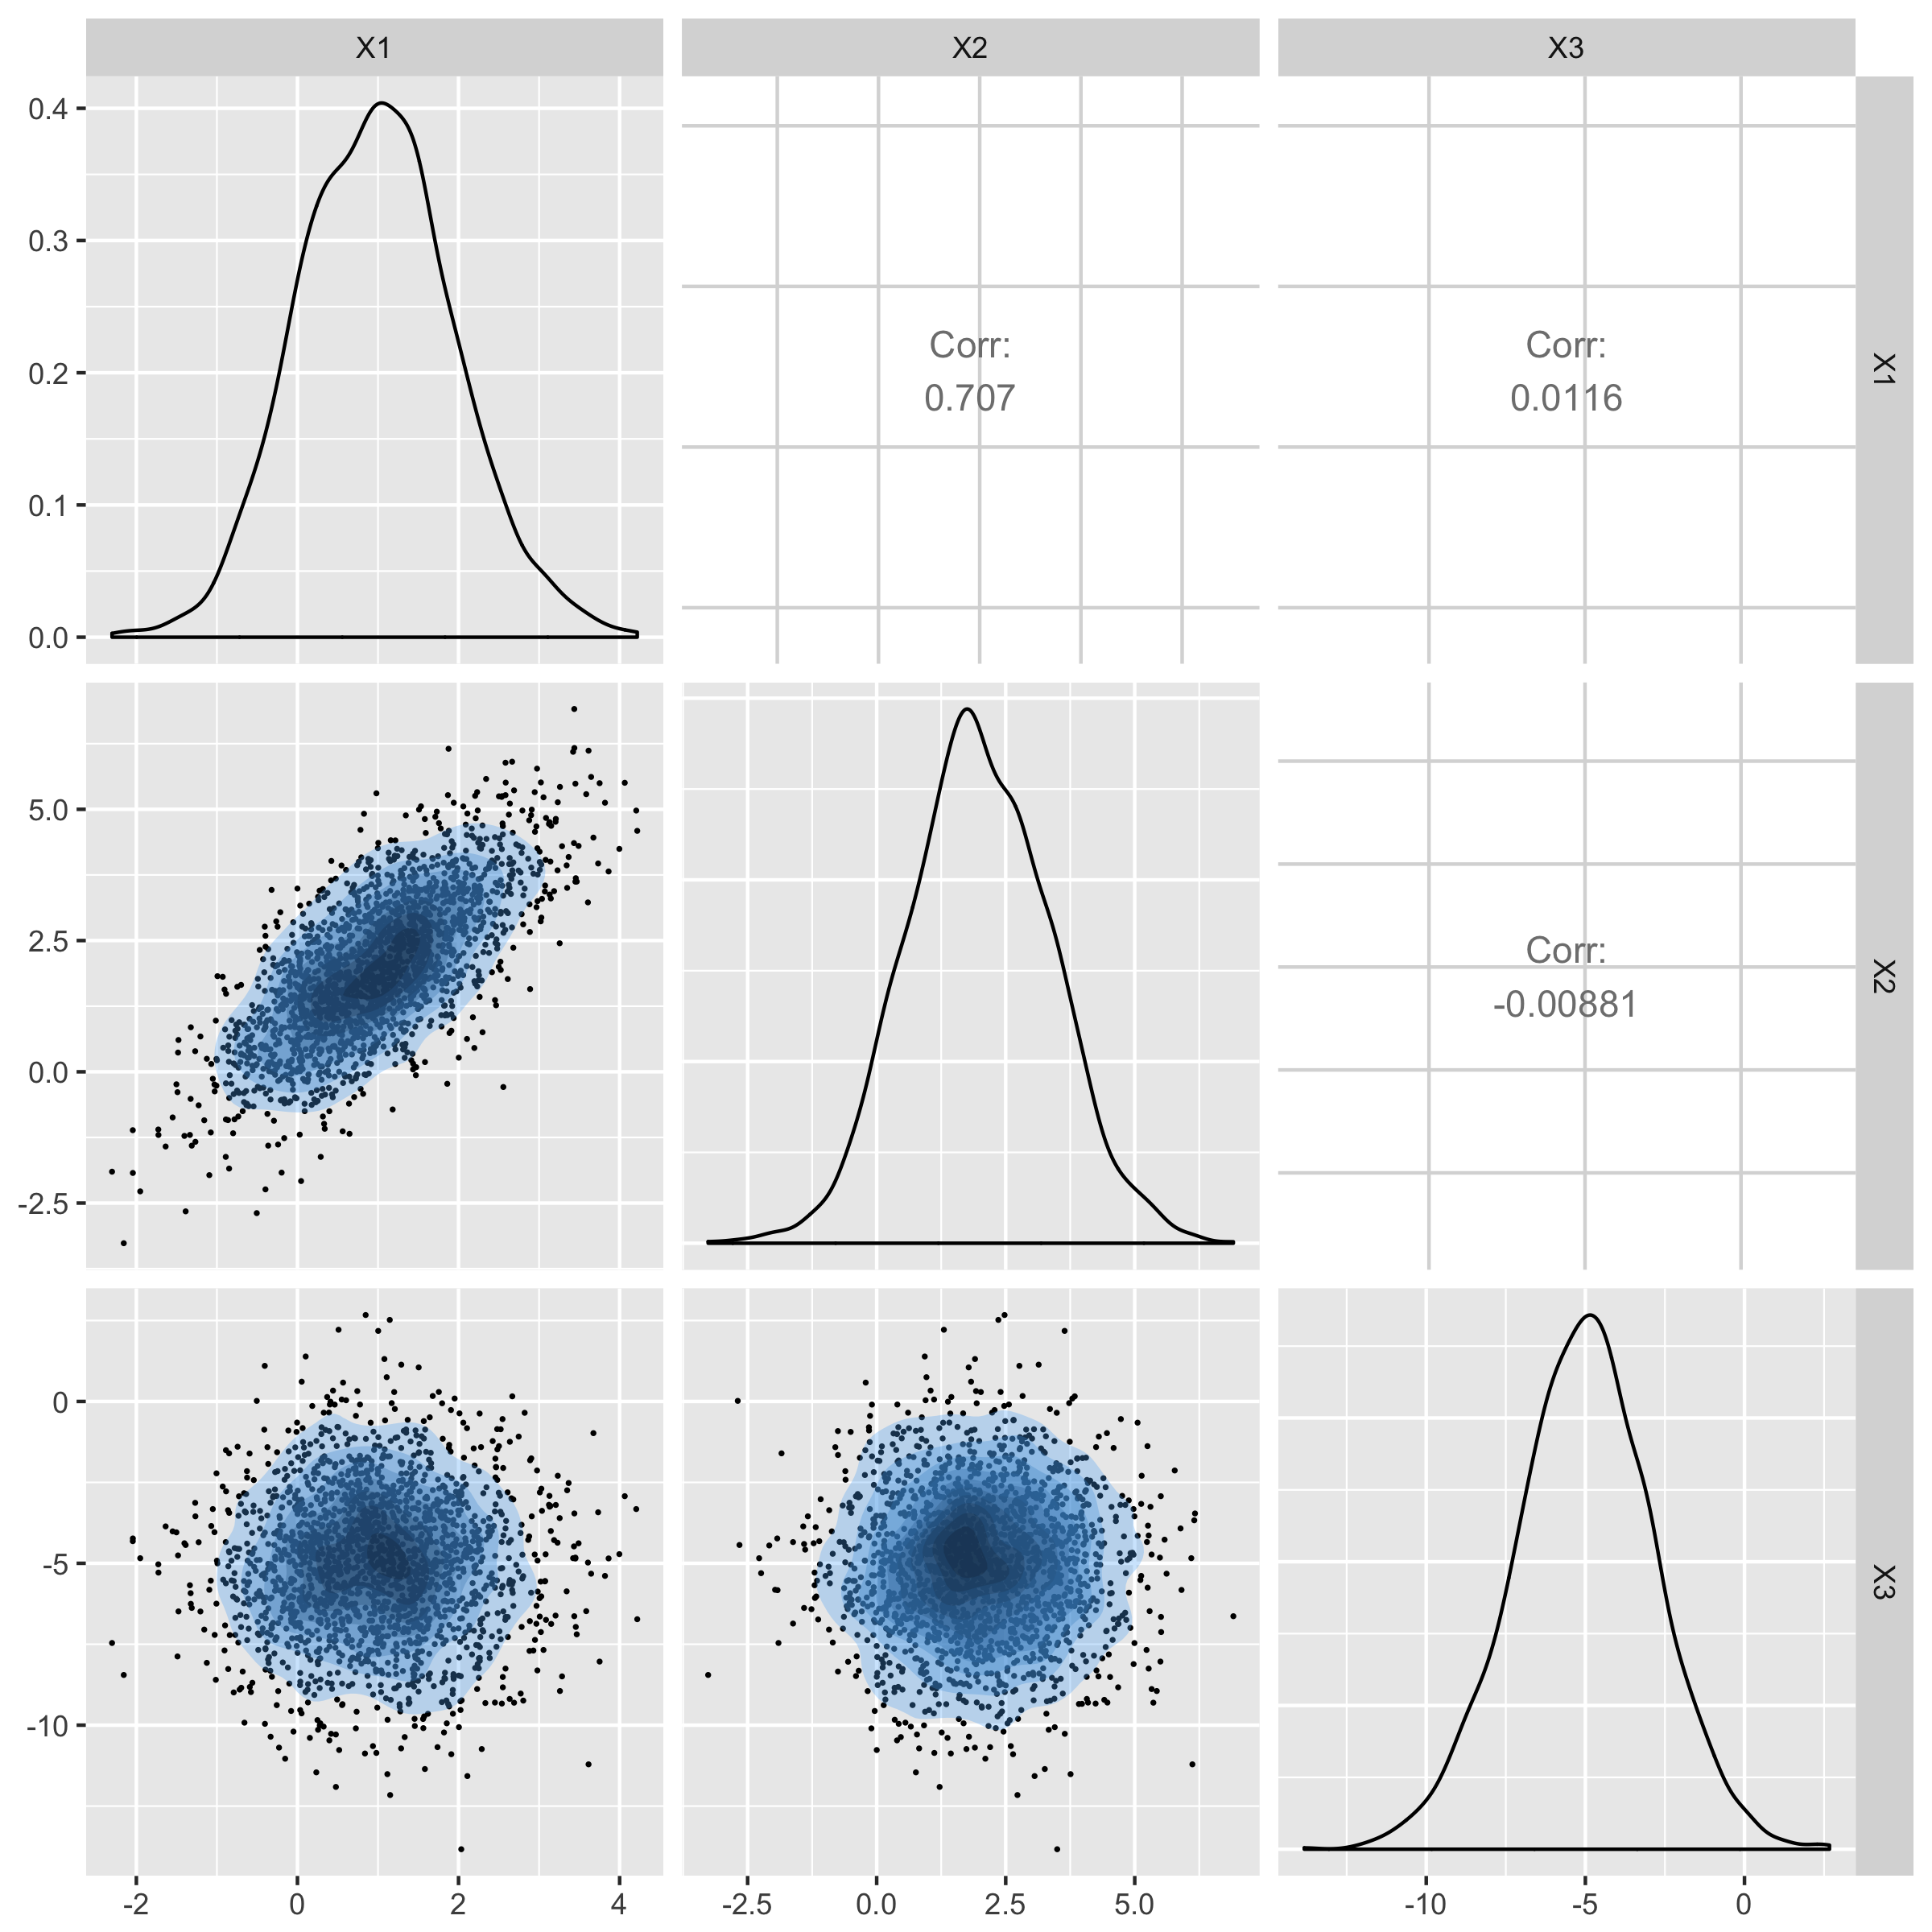
Plot of generated samples