Checking normality of multivariate data
Multivariate Probability Distributions in R

Surajit Ray
Professor, University of Glasgow
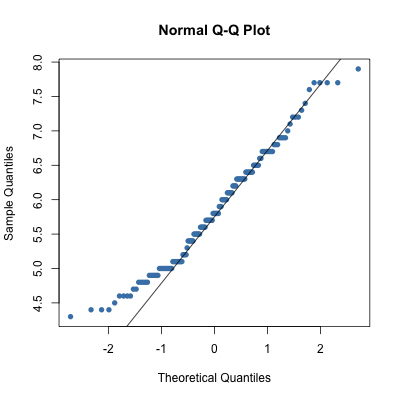
Review: univariate normality tests
qqnorm(iris_raw[, 1])
qqline(iris_raw[, 1])
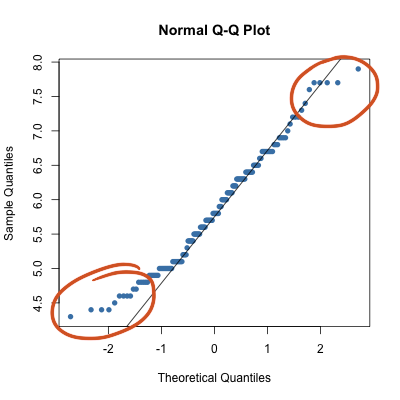
Review: univariate normality tests
qqnorm(iris_raw[, 1])
qqline(iris_raw[, 1])
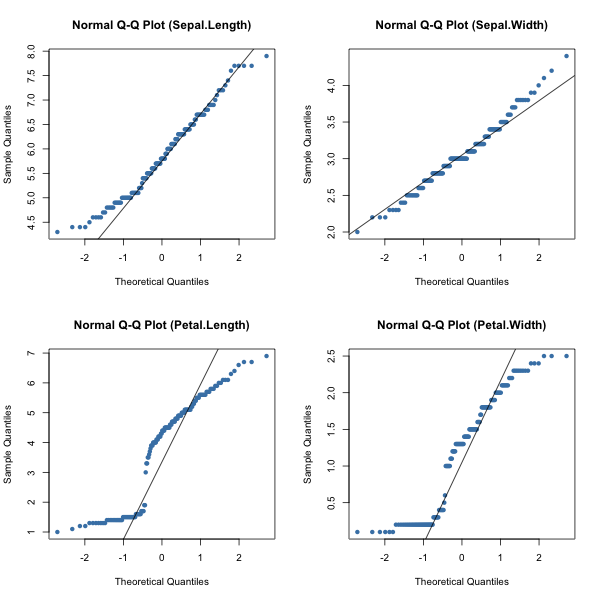
qqnorm of all variables
mvn(iris_raw[, 1:4], univariatePlot = "qqplot")
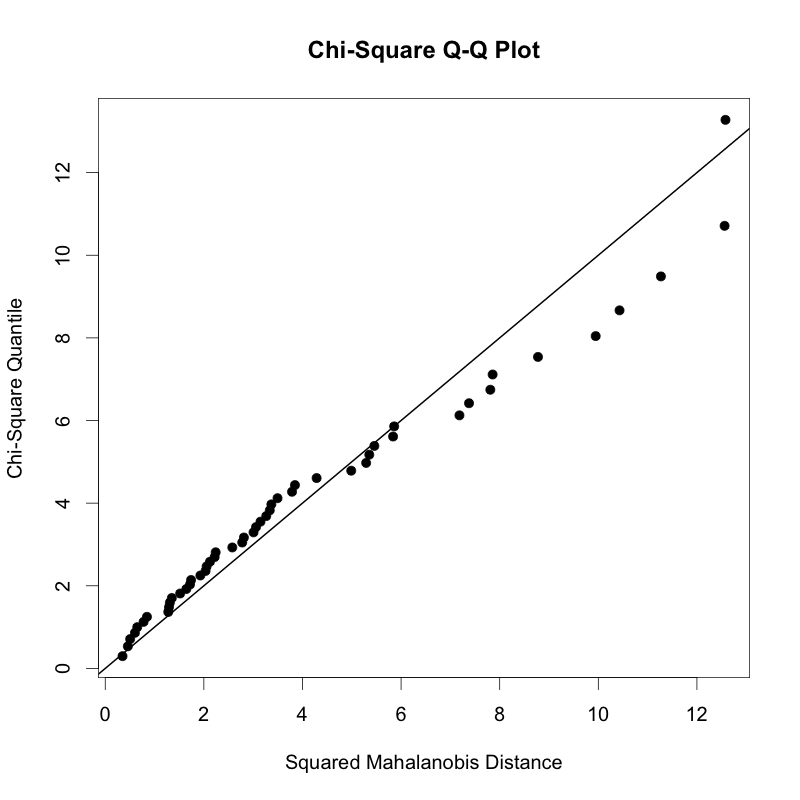
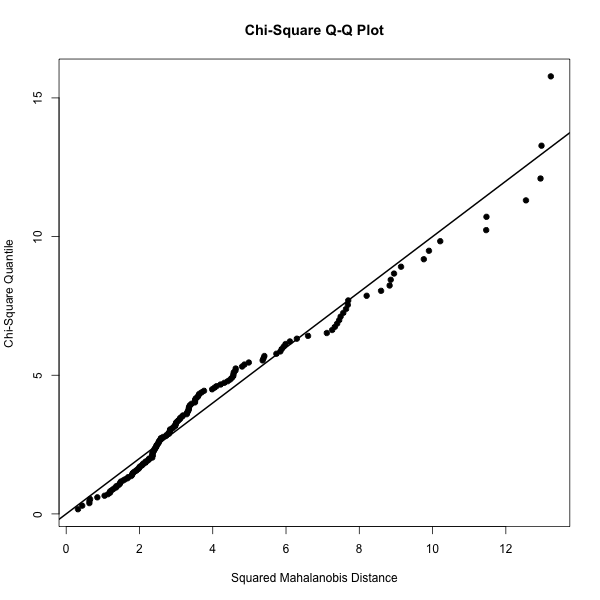
Using qqplot from Mardia Test to check multivariate normality
mvn(iris_raw[, 1:4],mvnTest = "mardia", multivariatePlot = "qq")
Testing multivariate normality by species