Experimental Design in R
Joanne Xiong
Data Scientist
library(dplyr)
mtcars %>%
    count(cyl)
    cyl  n
1   4     11
2   6      7
3   8     14
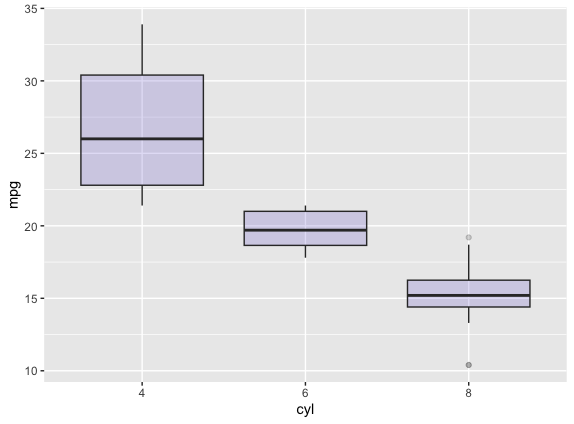
# Boxplot of MPG by Car Cylinders
ggplot(mtcars, aes(x=as.factor(cyl),
                   y=mpg)) +
  geom_boxplot(fill="slateblue",
               alpha=0.2) +
  xlab("cyl")
lm(formula, data, na.action,...)
aov(formula, data = NULL, ...)
anova(object,...)