Logistic response models

Building Response Models in R

Kathrin Gruber

Assistant Professor of Econometrics Erasmus University Rotterdam

Logistic response function

  • Bounds model predictions between 0 and 1.
  • Assumes a curved relationship.

Building Response Models in R

A logistic model for beer demand

logistic.model <- glm(HOPPINESS ~ price.ratio, family = binomial, 
                      data = choice.data)
coef(logistic.model)
(Intercept)  price.ratio 
  -3.572678   -6.738768 
Building Response Models in R

Bounded predictions

plot(HOPPINESS ~ price.ratio, data = choice.data)
curve(predict(logistic.model, data.frame(price.ratio = x), 
              type = "response"), add = TRUE)
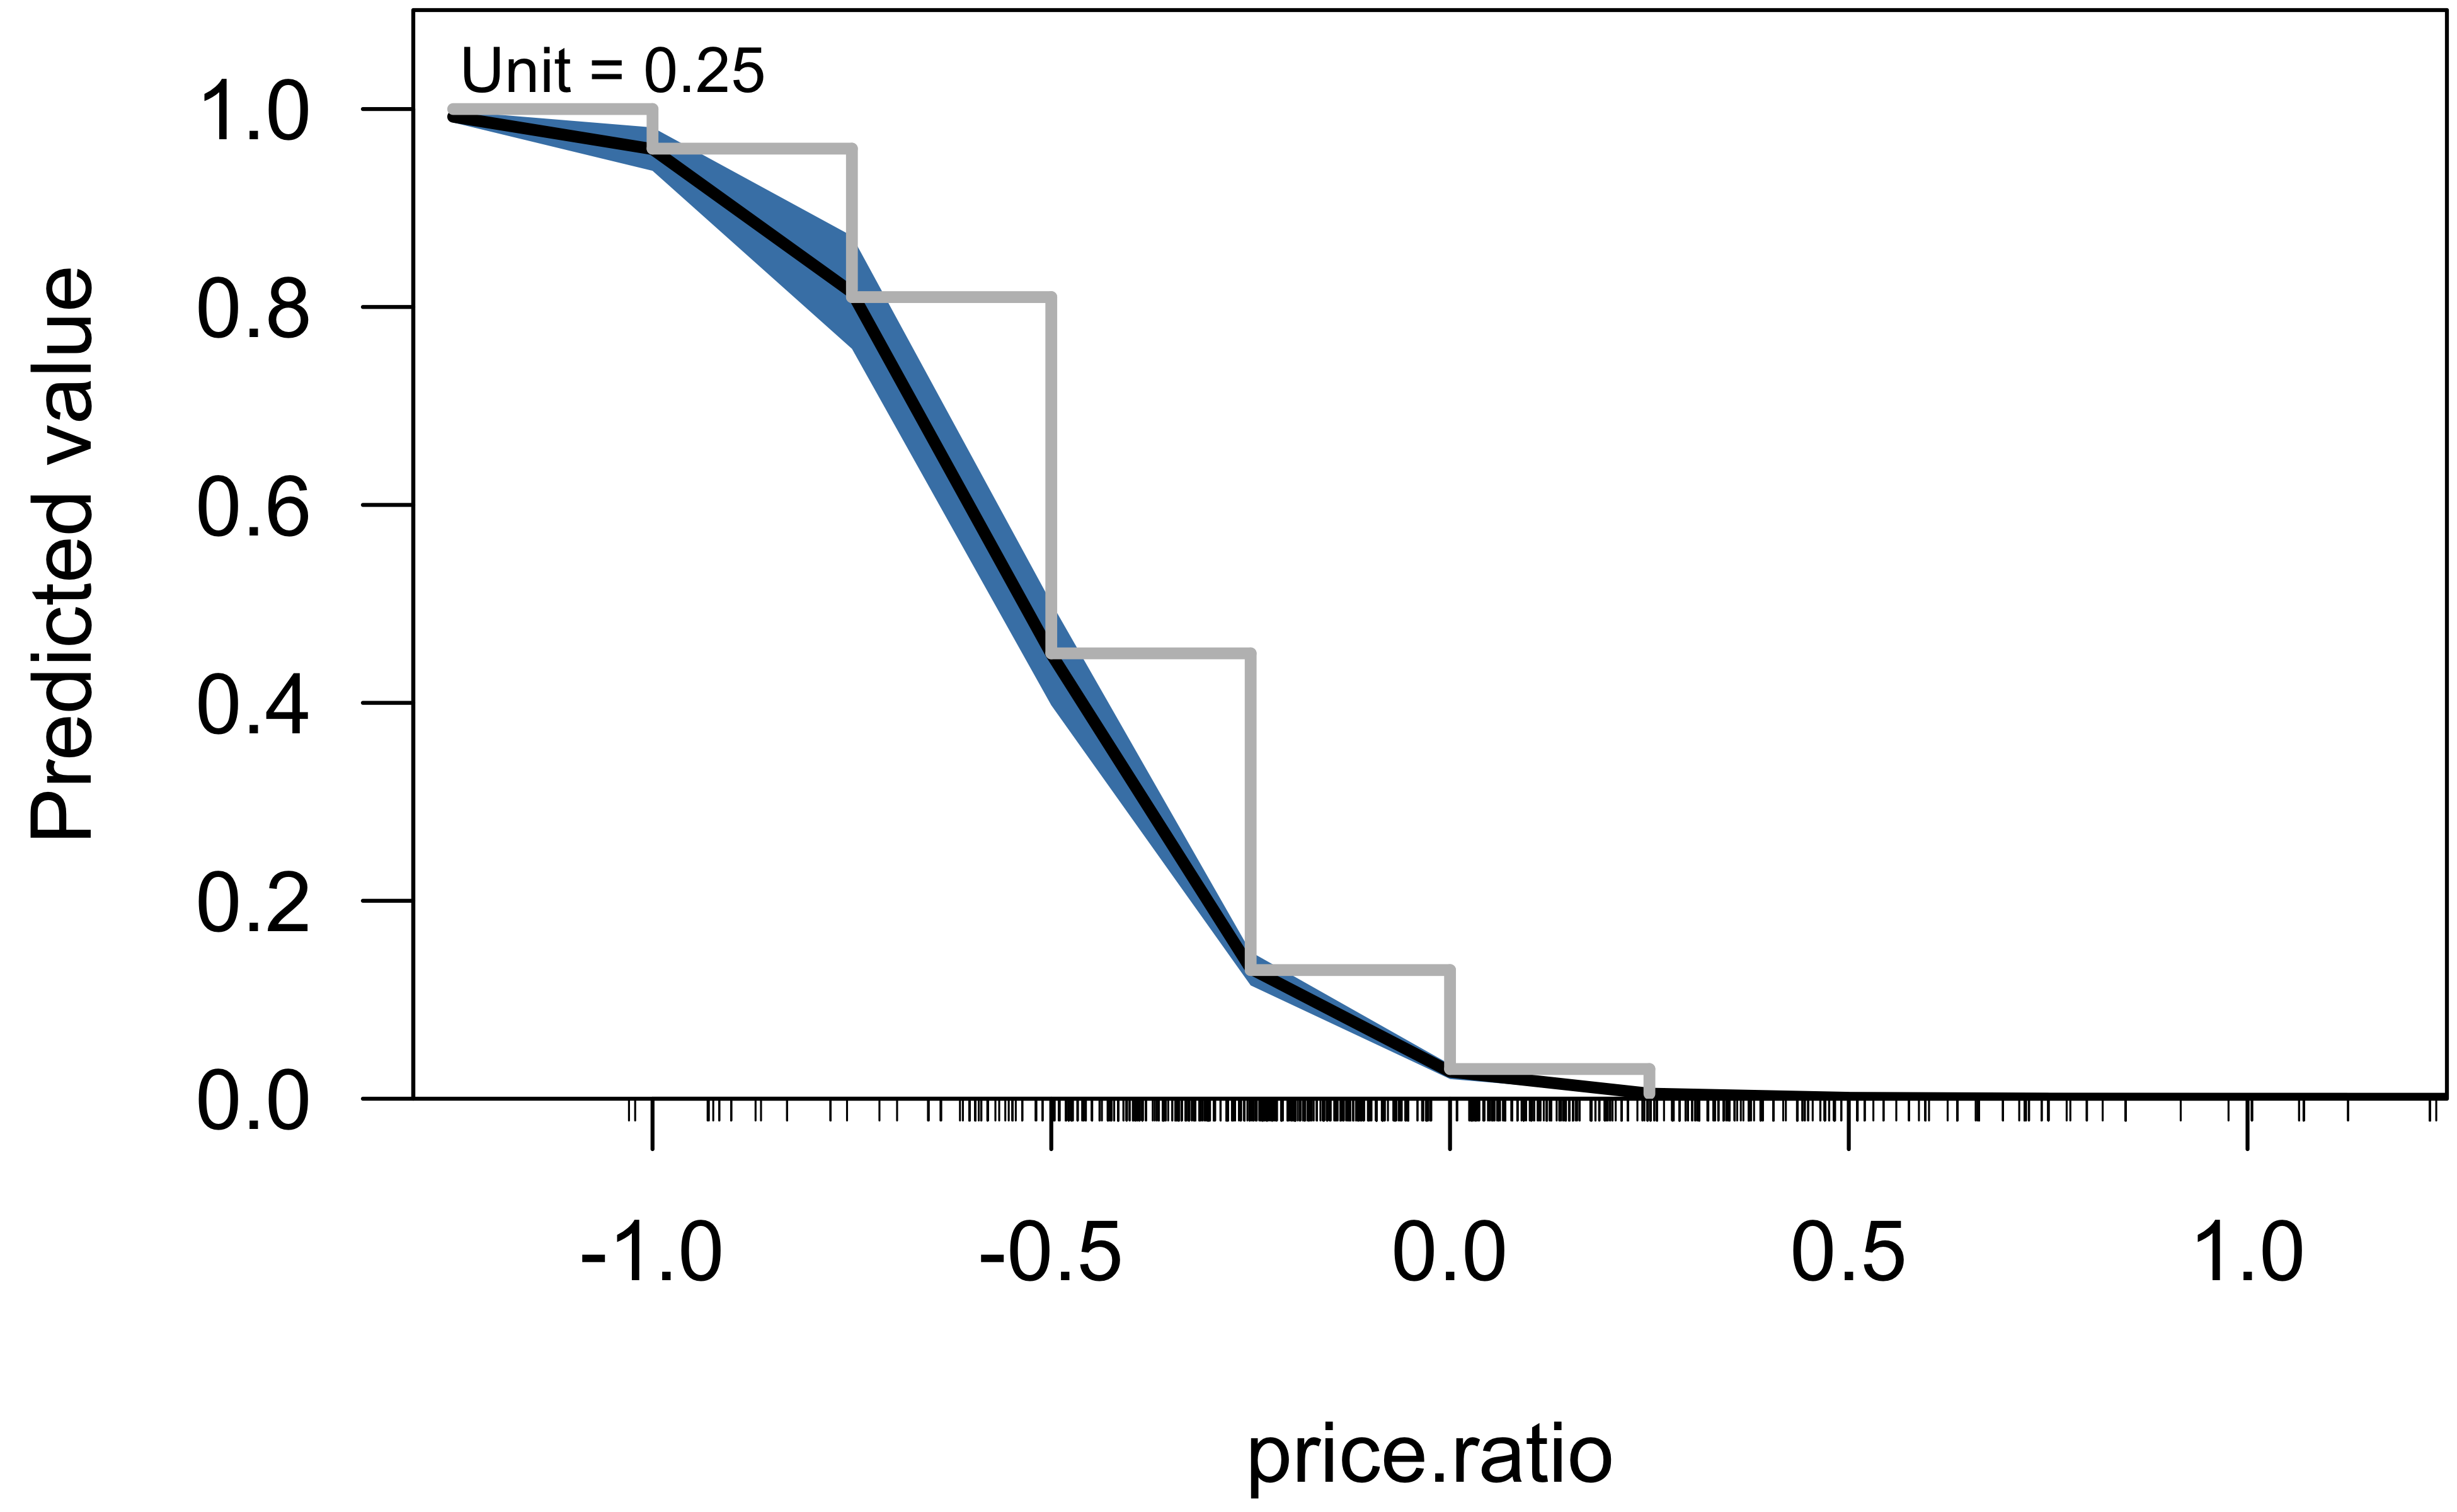
Building Response Models in R

Average marginal effects

  • Nonlinear logistic model:
margins(logistic.model)
price.ratio
    -0.4585
  • Linear probability model
coef(probability.model)
(Intercept)  price.ratio 
 0.09700236  -0.29594939 
Building Response Models in R

Effect plots

x <- seq(-1.25, 1.25, by = 0.25)
cplot(logistic.model, "price.ratio", xvals = x)

Building Response Models in R

Let's practice!

Building Response Models in R

Preparing Video For Download...