Nonlinear response models

Building Response Models in R

Kathrin Gruber

Assistant Professor of Econometrics Erasmus University Rotterdam

Linear response function

  • What happens when PRICE is zero or very large?
  • What about threshold effects?

Building Response Models in R

Exponential response function

  • Assumes a constant percentage change (growth rate).


Building Response Models in R

Linearizing

  • Nonlinear model: $\ \ \ \ \ \ \ \ \ \textsf{Sales} \ \ = \ \ \ \ \beta_0 \star \exp(\beta_1 \star \textsf{Price})$

  • Linearized model: $\ \log (\textsf{Sales}) = \ \log (\beta_0) + (\beta_1 \star \textsf{Price})$

log.model <- lm(log(SALES) ~ PRICE, data = sales.data)

coef(log.model)
(Intercept)       PRICE 
  5.0843983  -0.6622516
  • percentage change: $\beta_1 \star 100$ = (-) 66 %
Building Response Models in R

What's the value added?

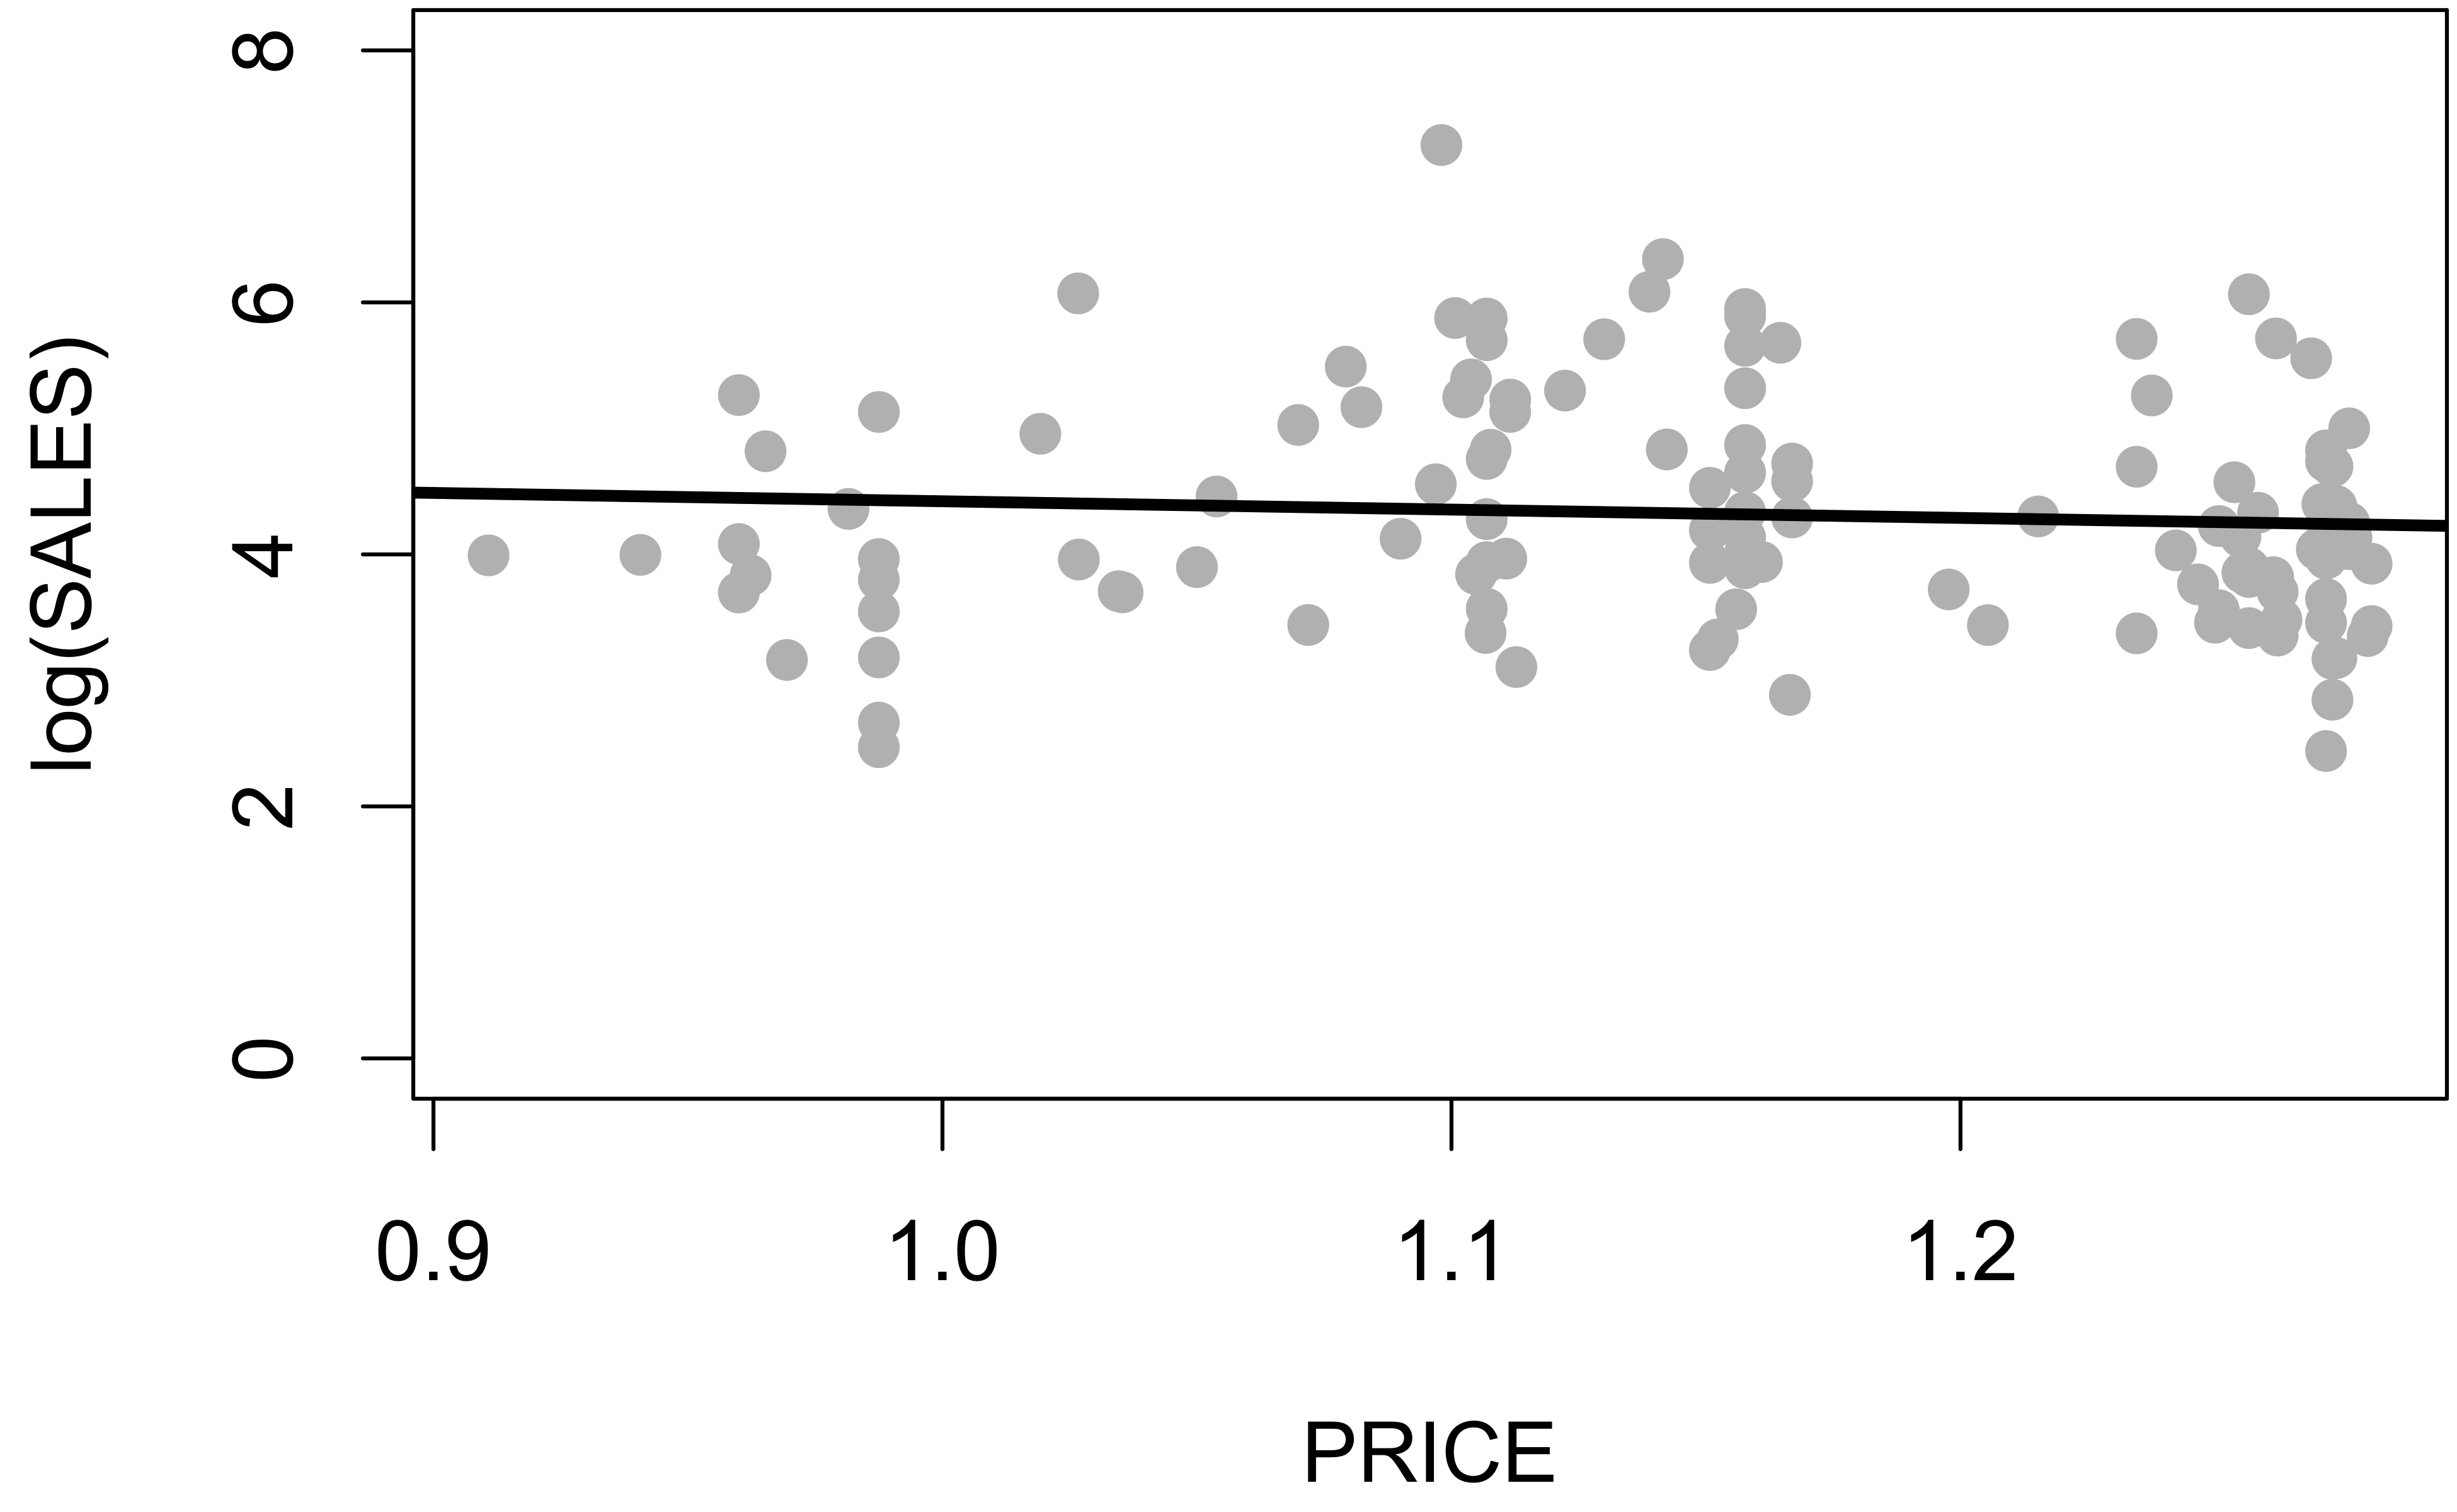
plot(log(SALES) ~ PRICE, data = sales.data)
log.model <- lm(log(SALES) ~ PRICE, data = sales.data)
abline(log.model)

Building Response Models in R

Let's practice!

Building Response Models in R

Preparing Video For Download...