Model extensions part 2: Lagged effects

Building Response Models in R

Kathrin Gruber

Assistant Professor of Econometrics Erasmus University Rotterdam

About lags

Carry-over effect

  • Time span between marketing activities and response.
  • Evaluation of several time periods by back-shifting.

How to lag?

head(cbind(sales.data$PRICE, 
           lag(sales.data$PRICE, n = 1)))
        [,1]     [,2]
[1,] 1.090000       NA
[2,] 1.271818 1.090000
[3,] 1.271818 1.271818
[4,] 1.271818 1.271818
[5,] 1.271818 1.271818
[6,] 1.271818 1.271818
Building Response Models in R

Adding lagged price effects

Price.lag <- lag(sales.data$PRICE)

lag.model <- lm(log(SALES) ~ PRICE + Price.lag, data = sales.data)
coef(lag.model)
(Intercept)        PRICE    Price.lag  
      3.906       -4.579        4.935
Building Response Models in R

More lags

Coupon.lag <-  lag(sales.data$COUPON)

lm(update(lag.model, . ~ . + COUPON + Coupon.lag), data = sales.data)
Call:
lm(formula = update(lag.model, . ~ . + COUPON + Coupon.lag), data = sales.data)

Coefficients:
(Intercept)        PRICE    Price.lag       COUPON   Coupon.lag  
     3.8327      -4.5050       4.8426       0.9697       0.3840
Building Response Models in R

What's the value added?

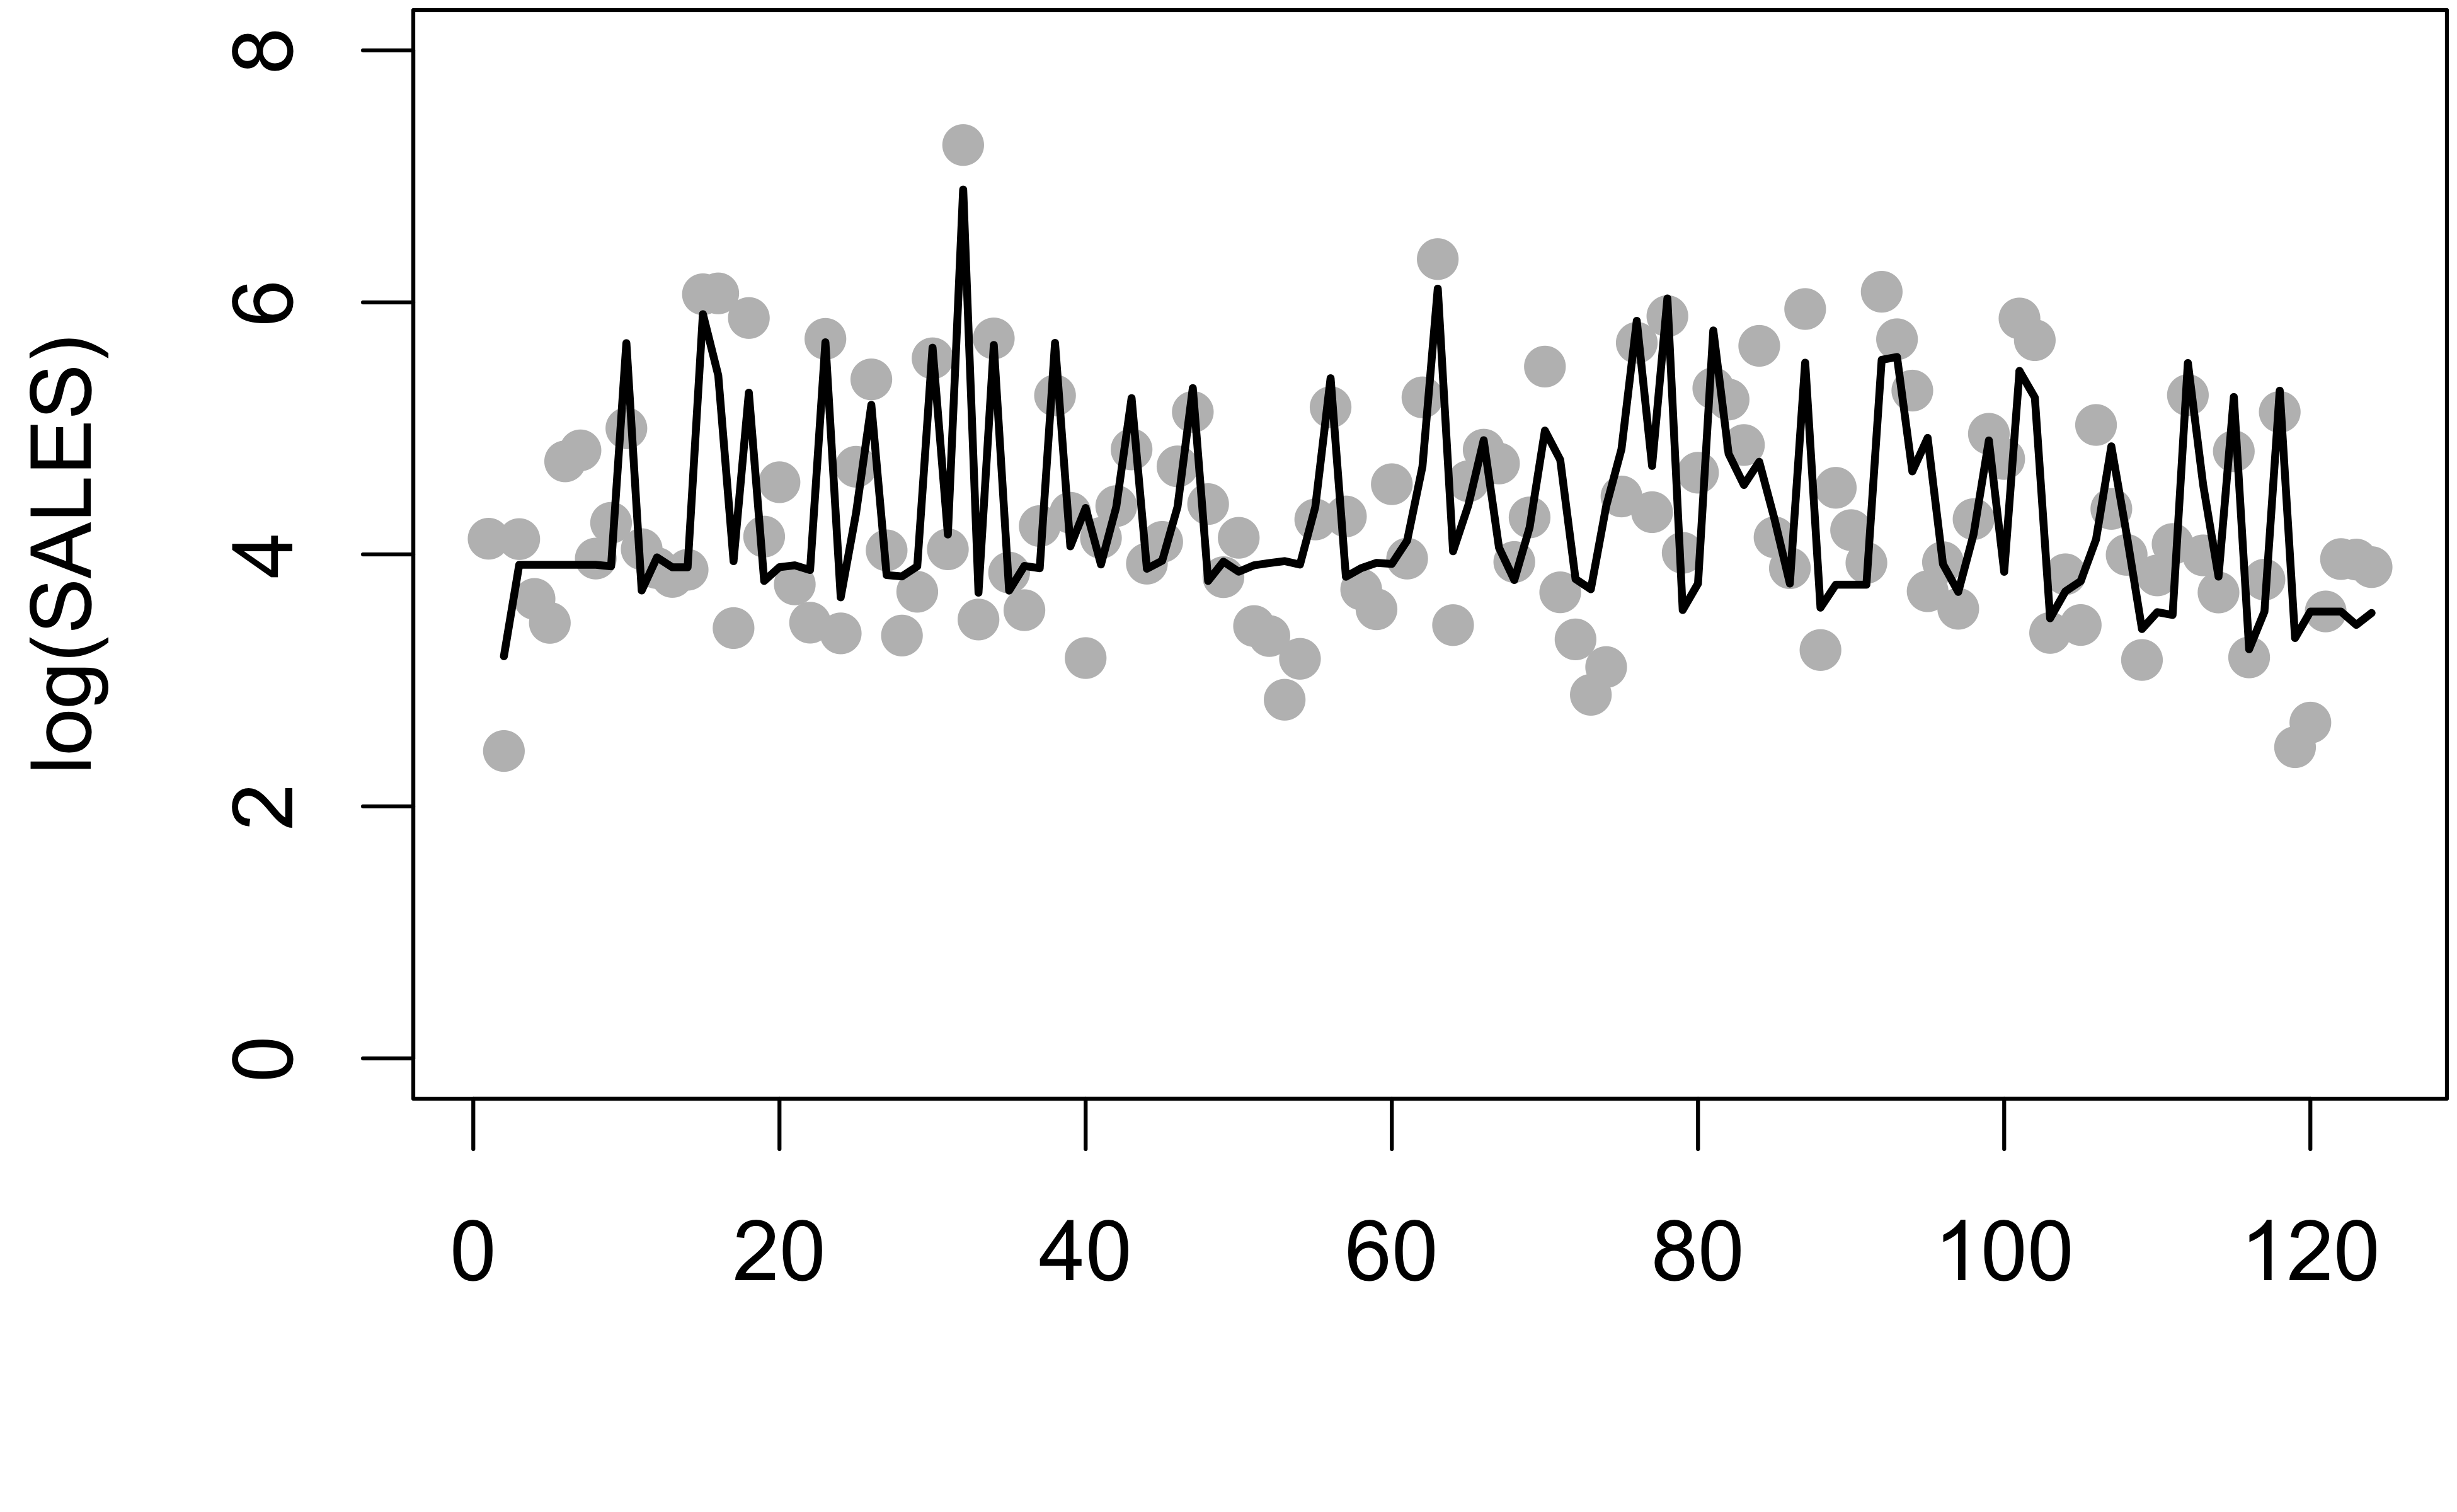
lag.model <- lm(log(SALES) ~ PRICE + Price.lag + DISPLAY + Display.lag + 
                COUPON + Coupon.lag + DISPLAYCOUPON + DisplayCoupon.lag, 
                data = sales.data)

plot(log(SALES) ~ 1, data = sales.data) lines(c(NA, fitted.values(lag.model)) ~ 1)

Building Response Models in R

Let's practice!

Building Response Models in R

Preparing Video For Download...