Predictive performance
Building Response Models in R

Kathrin Gruber
Assistant Professor of Econometrics Erasmus University Rotterdam
Classification
predicted <- ifelse(fitted.values(extended.mod) >= 0.5, 1, 0)table(predicted)/2798
predicted
      0       1
0.96605 0.03395
Model confusion
observed <- choice.data$HOPPINESS
table(observed, predicted)/2798
        predicted
observed       0       1
       0 0.88849 0.01144
       1 0.07756 0.02252
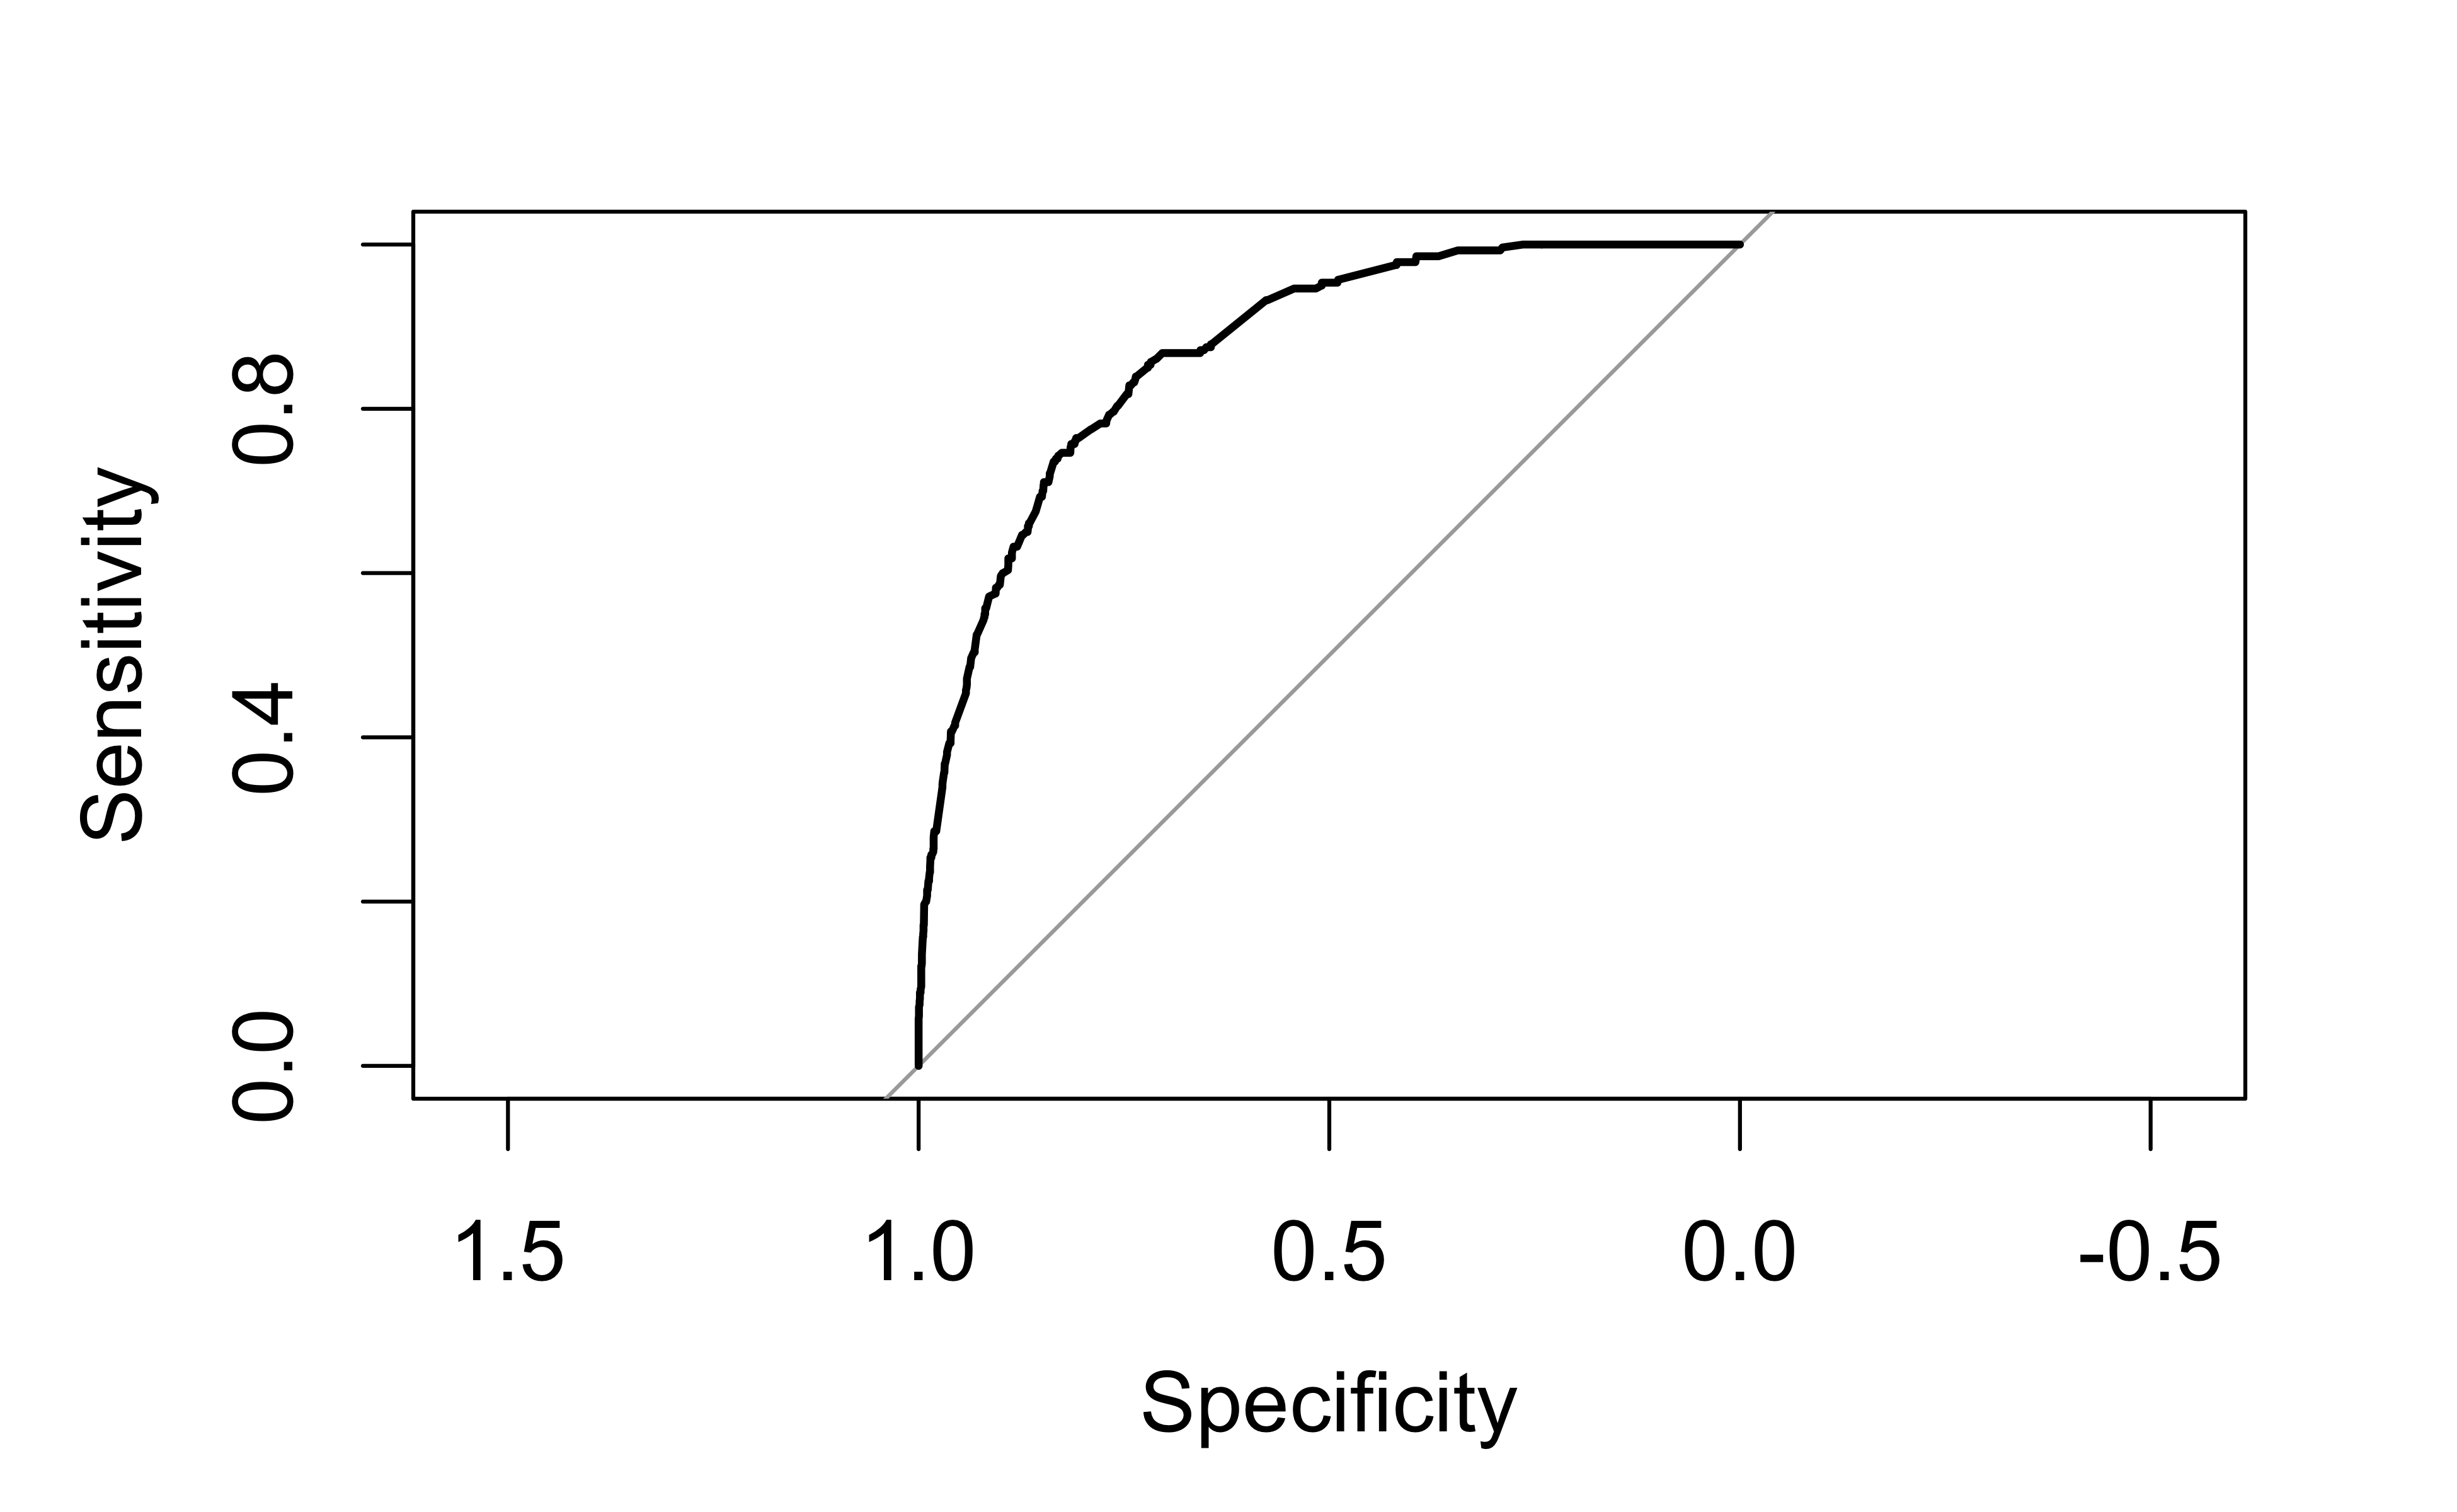
ROC curves
library(pROC) Roc <- roc(predictor = fitted.values(extended.mod), response = observed)plot(Roc)

Let's practice!
Building Response Models in R

