Visualizing a Bayesian model
Bayesian Regression Modeling with rstanarm

Jake Thompson
Psychometrician, ATLAS, University of Kansas
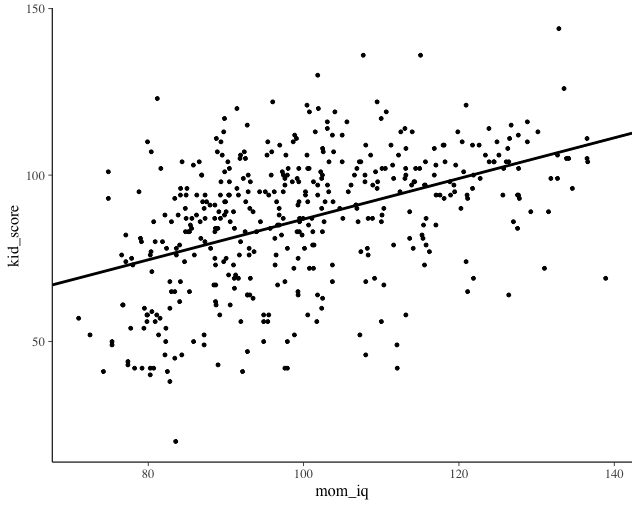
Creating a plot
ggplot(kidiq, aes(x = mom_iq, y = kid_score)) +
  geom_point() +
  geom_abline(intercept = model_intercept, slope = model_slope)
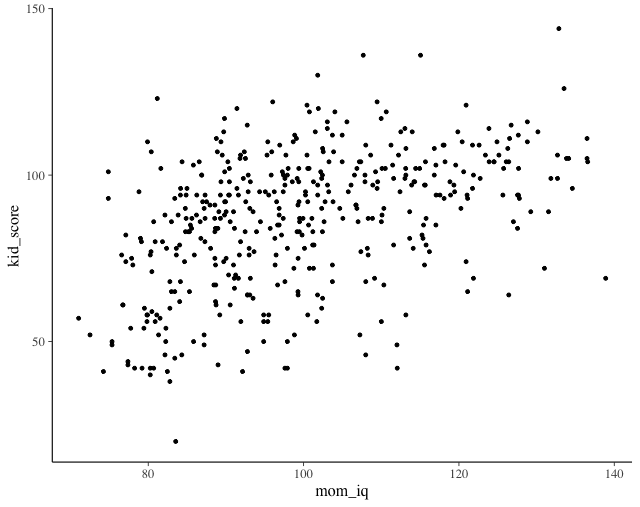
Plotting uncertainty
ggplot(kidiq, aes(x = mom_iq, y = kid_score)) +
  geom_point()
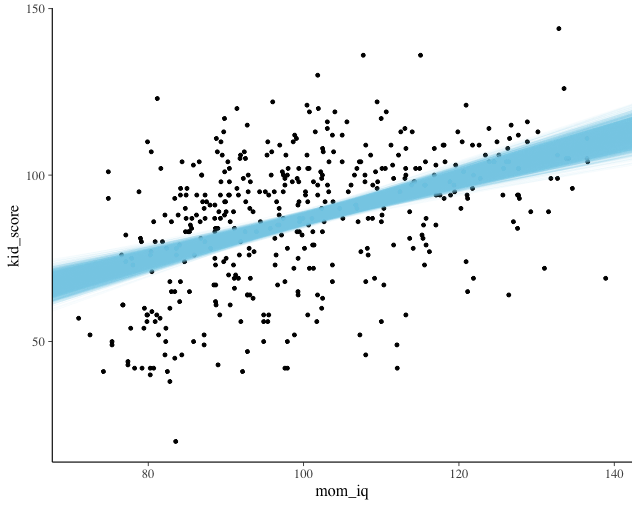
Plotting uncertainty
ggplot(kidiq, aes(x = mom_iq, y = kid_score)) +
  geom_point()
  geom_abline(data = draws, aes(intercept = `(Intercept)`, slope = mom_iq),
    size = 0.2, alpha = 0.1, color = "skyblue")
Plotting uncertainty
ggplot(kidiq, aes(x = mom_iq, y = kid_score)) +
  geom_point()
  geom_abline(data = draws, aes(intercept = `(Intercept)`, slope = mom_iq),
    size = 0.2, alpha = 0.1, color = "skyblue") +
  geom_abline(intercept = model_intercept, slope = model_slope)


