Analyzing Survey Data in R
Kelly McConville
Assistant Professor of Statistics
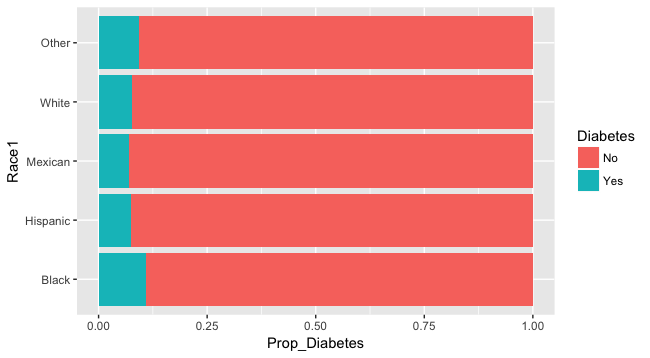
Null Hypothesis: Prevalence of diabetes is not associated with race.
Alternative Hypothesis: Prevalence of diabetes is associated with race.
svychisq(~Race1 + Diabetes,
         design = NHANES_design,
         statistic = "Chisq")
    Pearsons X^2: Rao & Scott adjustment

data:  svychisq(~Race1 + Diabetes, design = NHANES_design,
statistic = "Chisq")
X-squared = 37.708, df = 4, p-value = 0.0001177