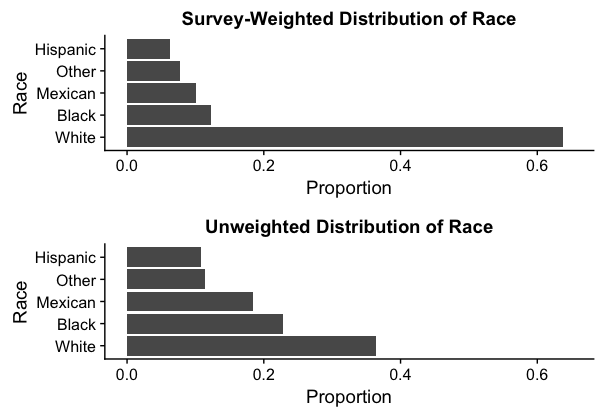
Impact of weights
Analyzing Survey Data in R

Kelly McConville
Assistant Professor of Statistics
National Health and Nutrition Examination Survey (NHANES)
- Conducted by the U.S. National Center for Health Statistics.
- Goal: Understand the health of adults and children in the US.
It is collected using a 4 stage design.
Stage 0: The U.S. is stratified by geography and proportion of minority populations.
- Stage 1: Within strata, counties are randomly selected.
- Stage 2: Within counties, city blocks are randomly selected.
- Stage 3: Within city blocks, households randomly selected.
- Stage 4: Within households, people randomly selected.
NHANES
library(NHANES)
dim(NHANESraw)
20293 78
library(dplyr)
summarize(NHANESraw, N_hat = sum(WTMEC2YR))
# A tibble: 1 x 1
      N_hat
      <dbl>
 1 608534400
NHANESraw <- mutate(NHANESraw, WTMEC4YR = WTMEC2YR / 2)
NHANES
NHANES_design <- svydesign(data = NHANESraw, strata = ~SDMVSTRA, id = ~SDMVPSU, nest = TRUE, weights = ~WTMEC4YR)distinct(NHANESraw, SDMVPSU)
# A tibble: 3 x 1
  SDMVPSU
    <int>
 1       1
 2       2
 3       3
Visualizing impact of weights

Let's practice!
Analyzing Survey Data in R

