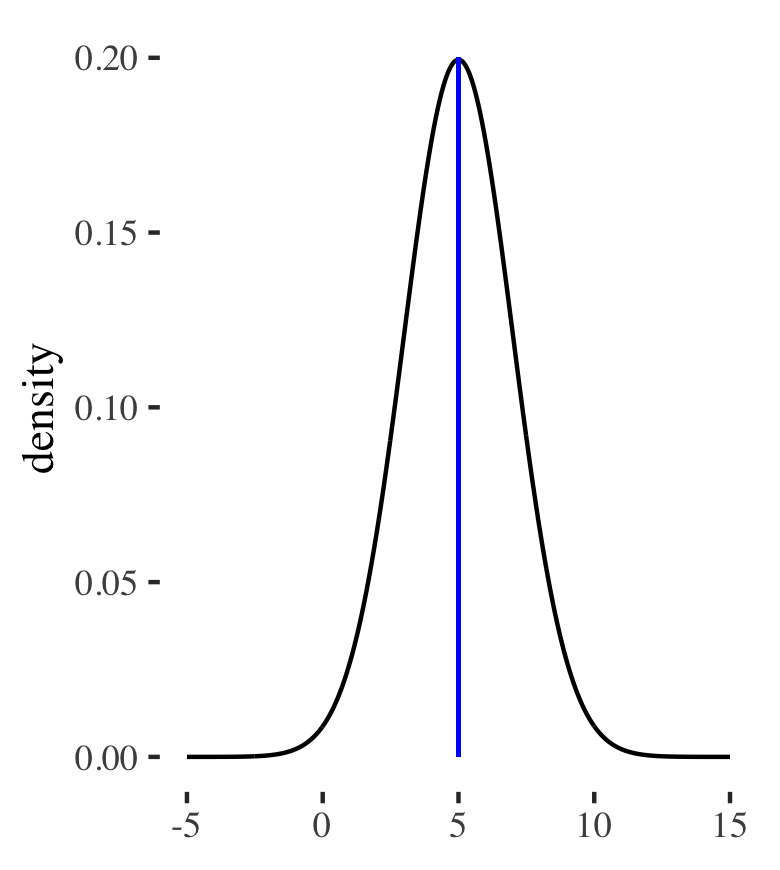
# Gaussian 1 "heads"
gauss_1 <- rnorm(n = number_of_obs, mean = 5, sd = 2)
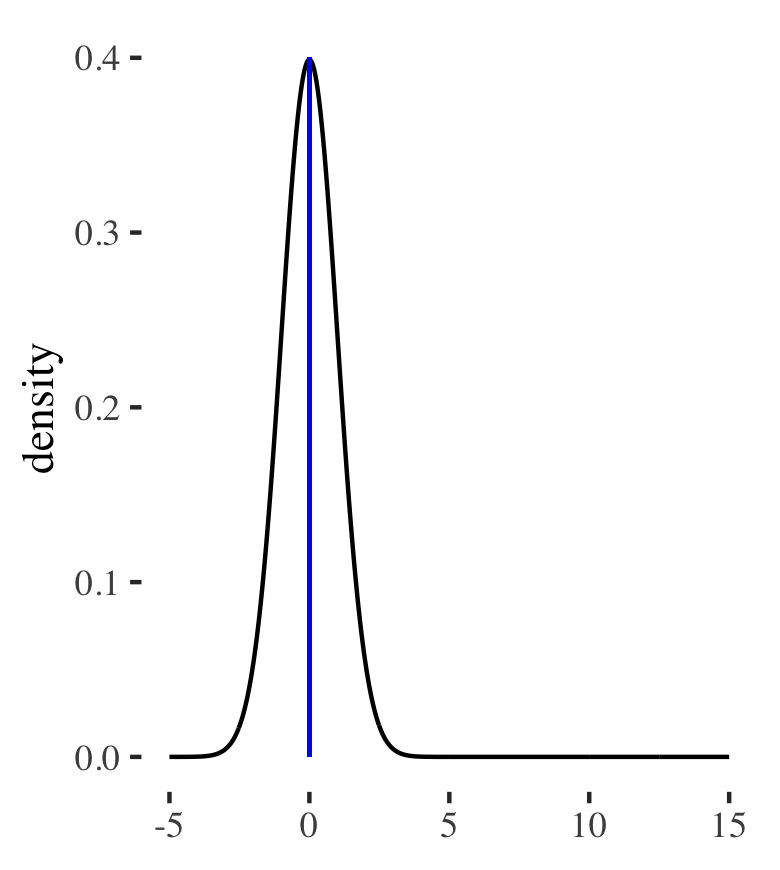
# Gaussian 2 "tails"
gauss_2 <- rnorm(n = number_of_obs)
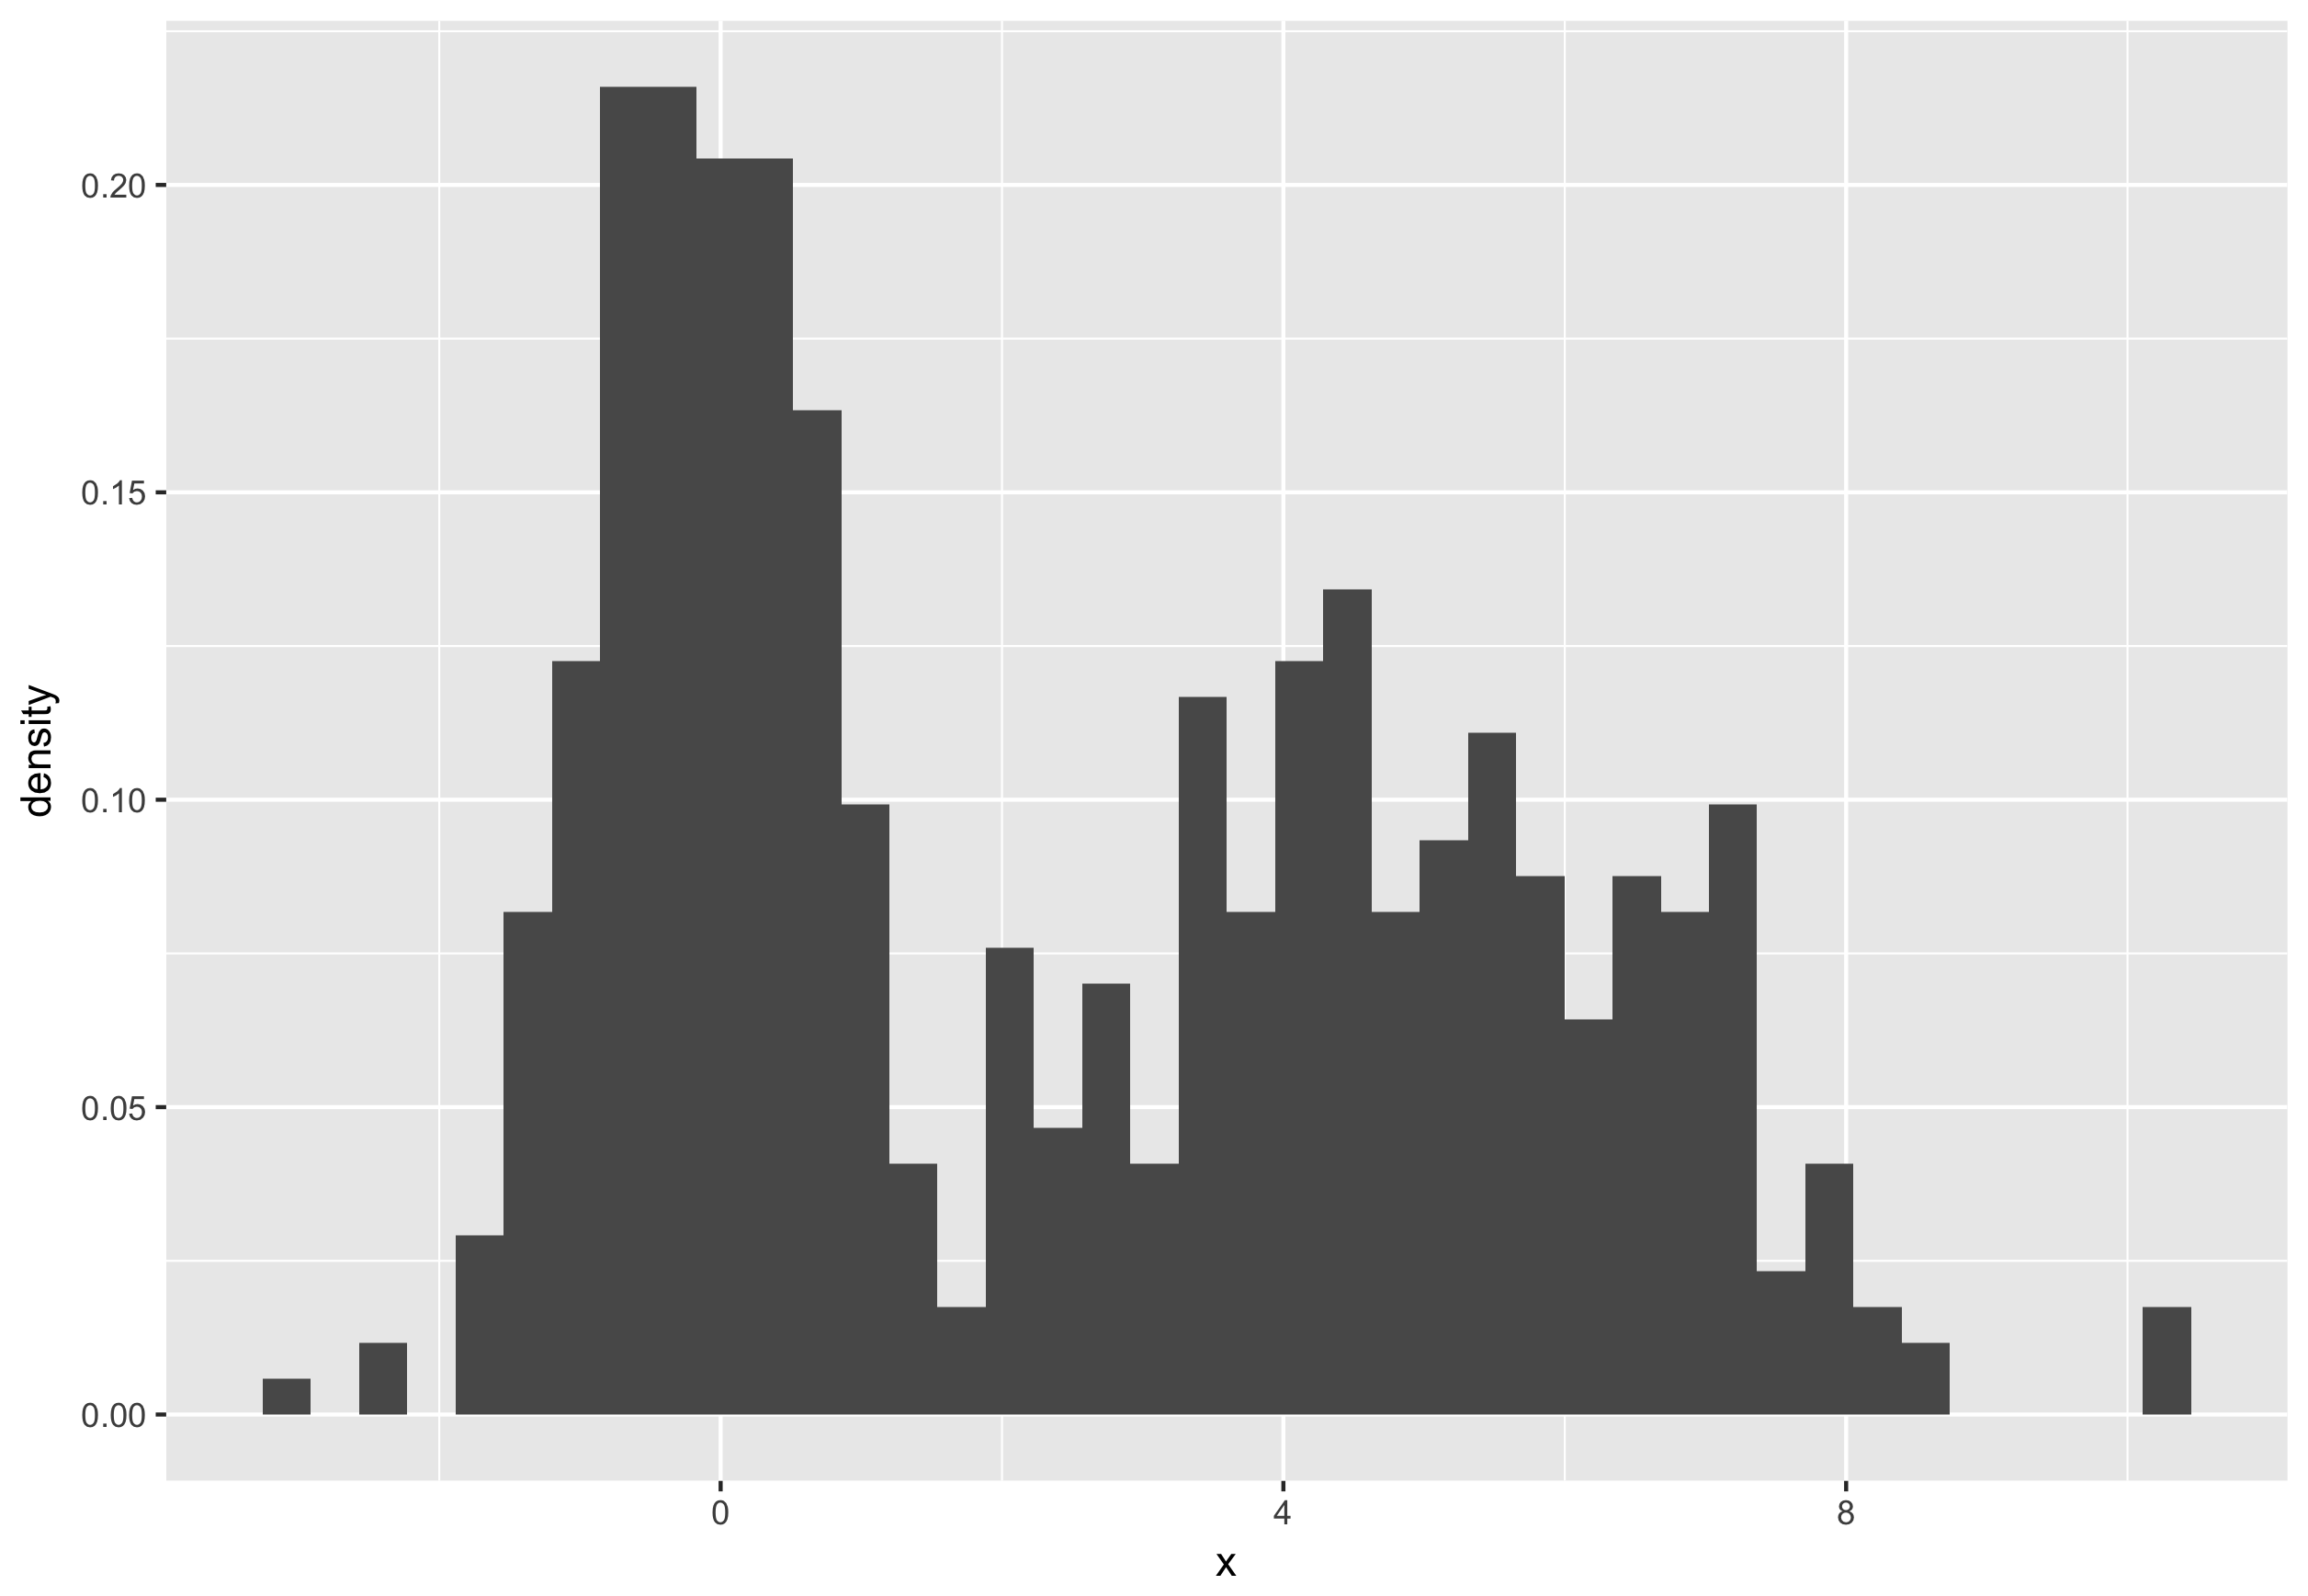
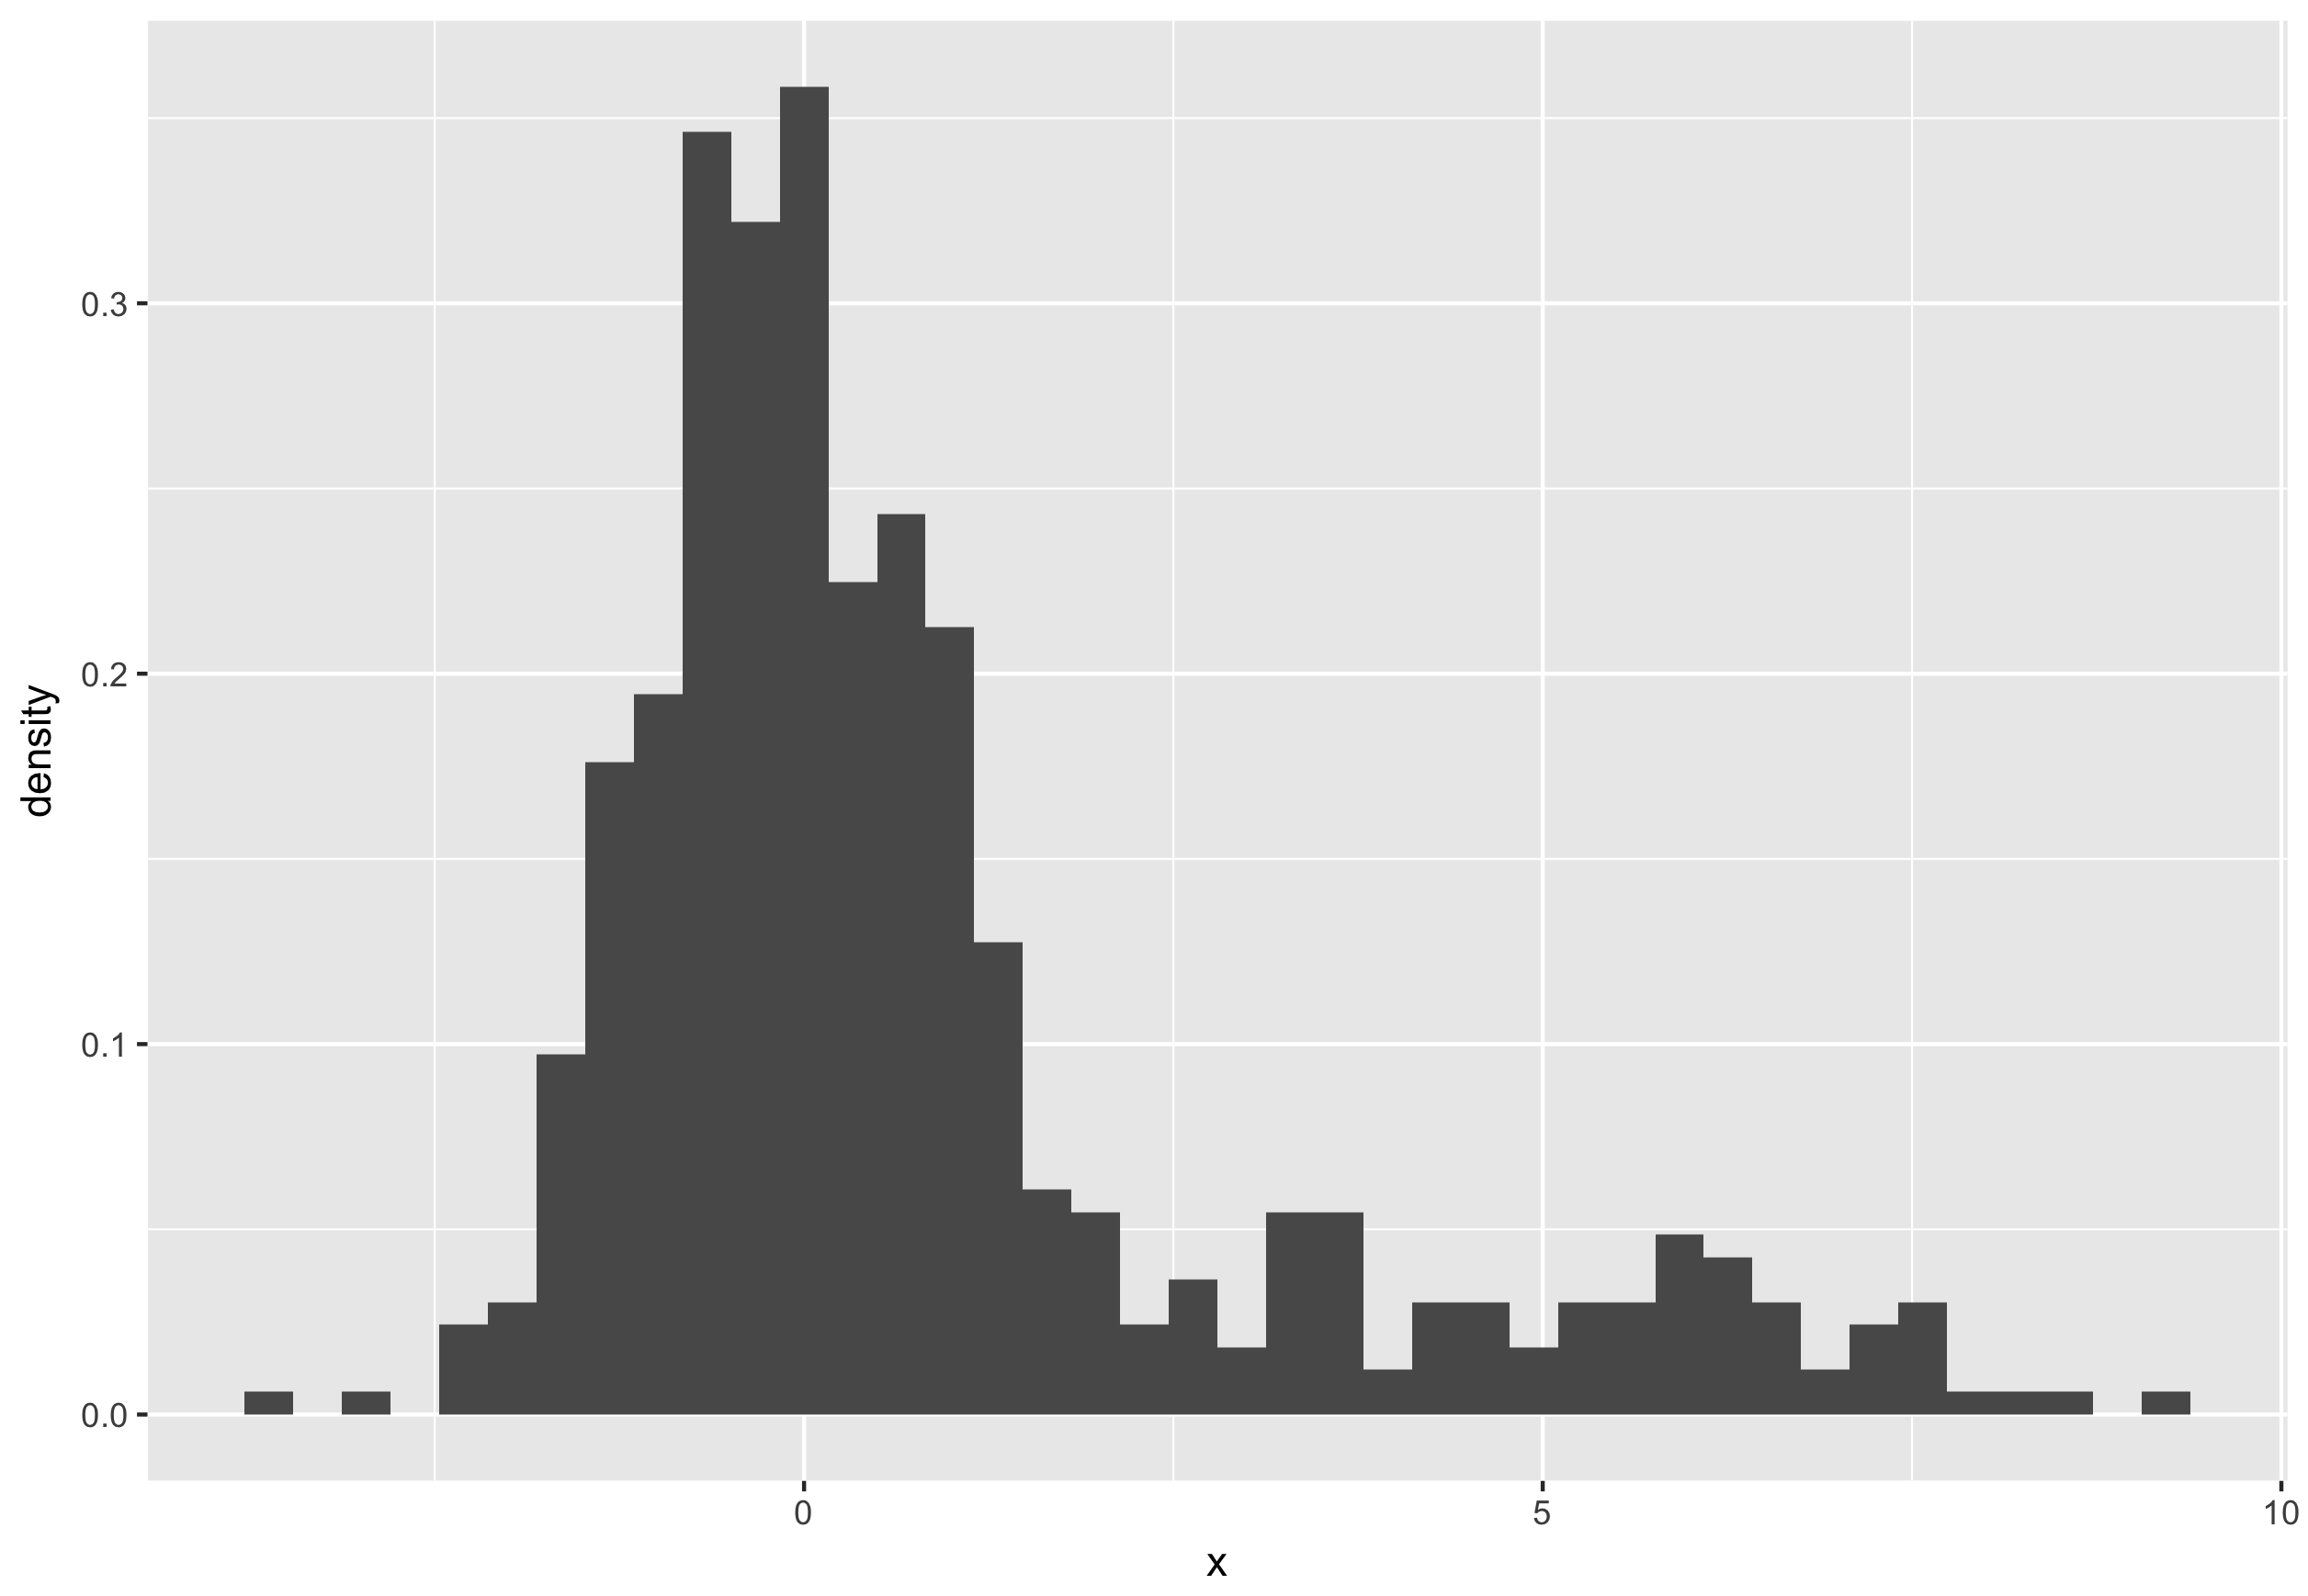
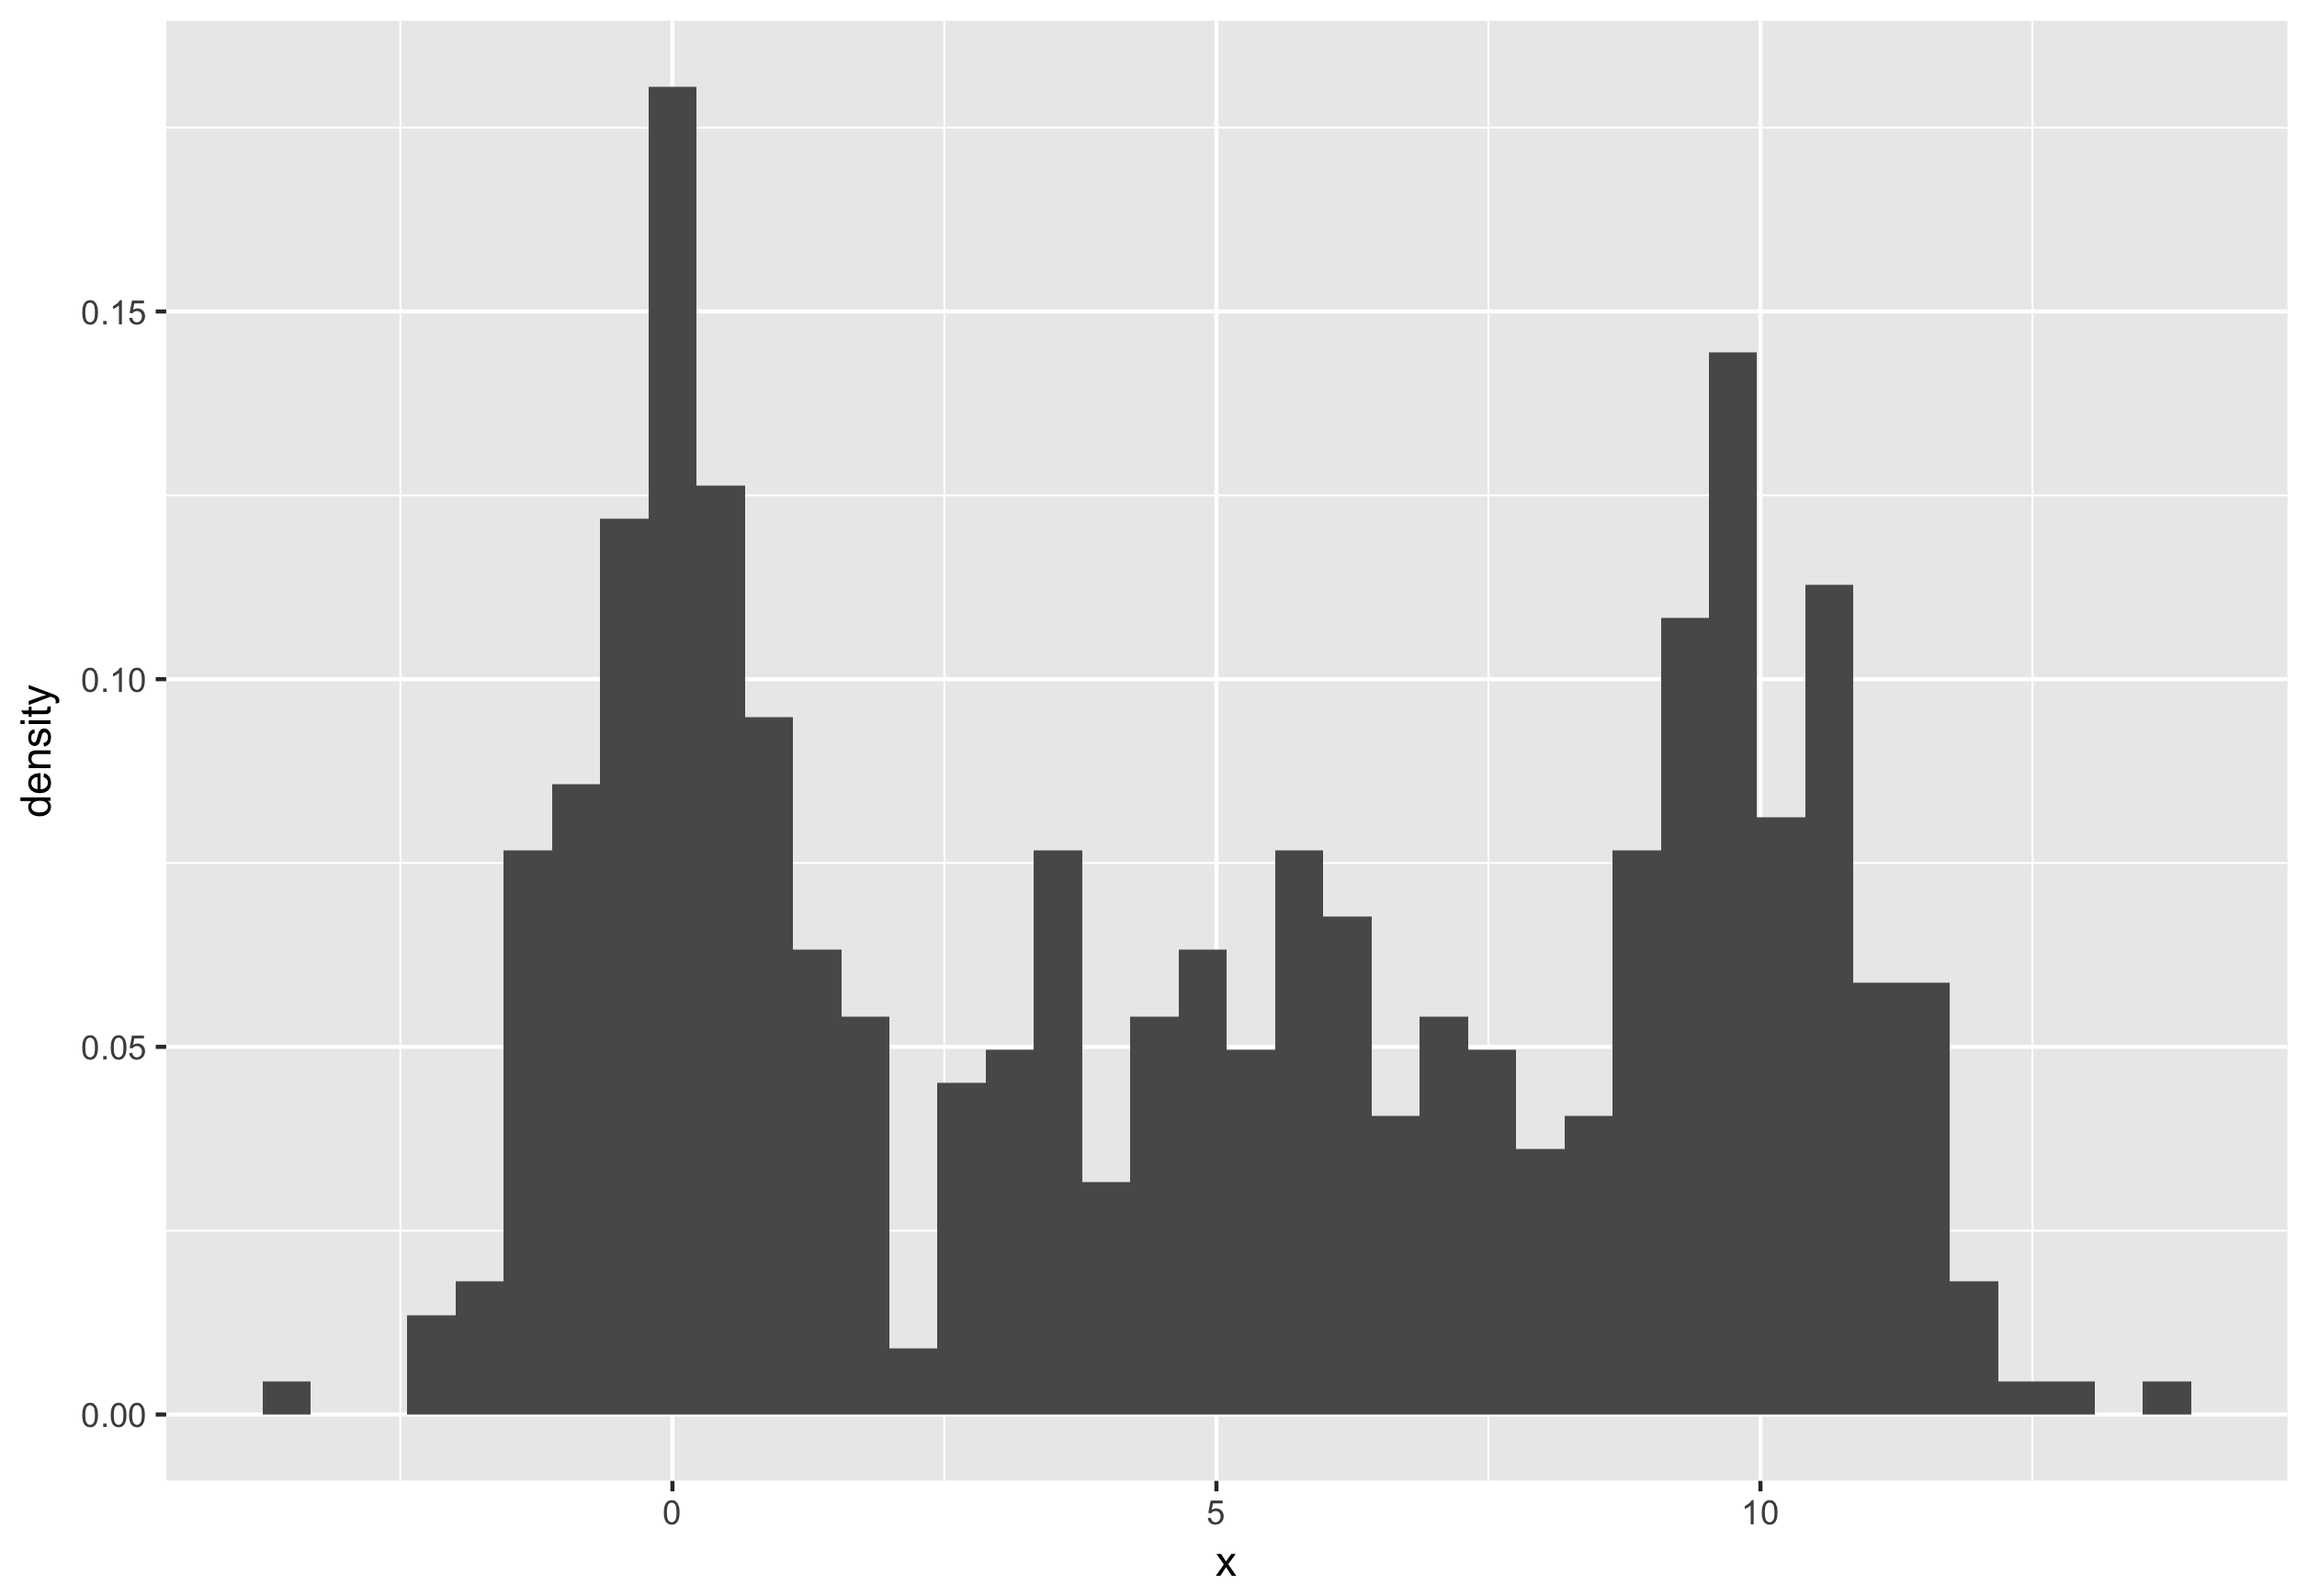
# Simulate the mixture
mixture_simulation <- ifelse(coin, gauss_1, gauss_2)
head(cbind(coin, gauss_1, gauss_2, mixture_simulation))
     coin  gauss_1    gauss_2 mixture_simulation
[1,]    0 7.378712 -0.4559596         -0.4559596
[2,]    1 6.102770  3.3595880          6.1027696
[3,]    0 5.707269 -0.0731496         -0.0731496
[4,]    1 3.592059 -1.2407104          3.5920586
[5,]    0 5.236851 -0.5110058         -0.5110058
[6,]    0 4.152619 -0.5124031         -0.5124031