Gaussian distribution
Mixture Models in R

Victor Medina
Researcher at The University of Edinburgh
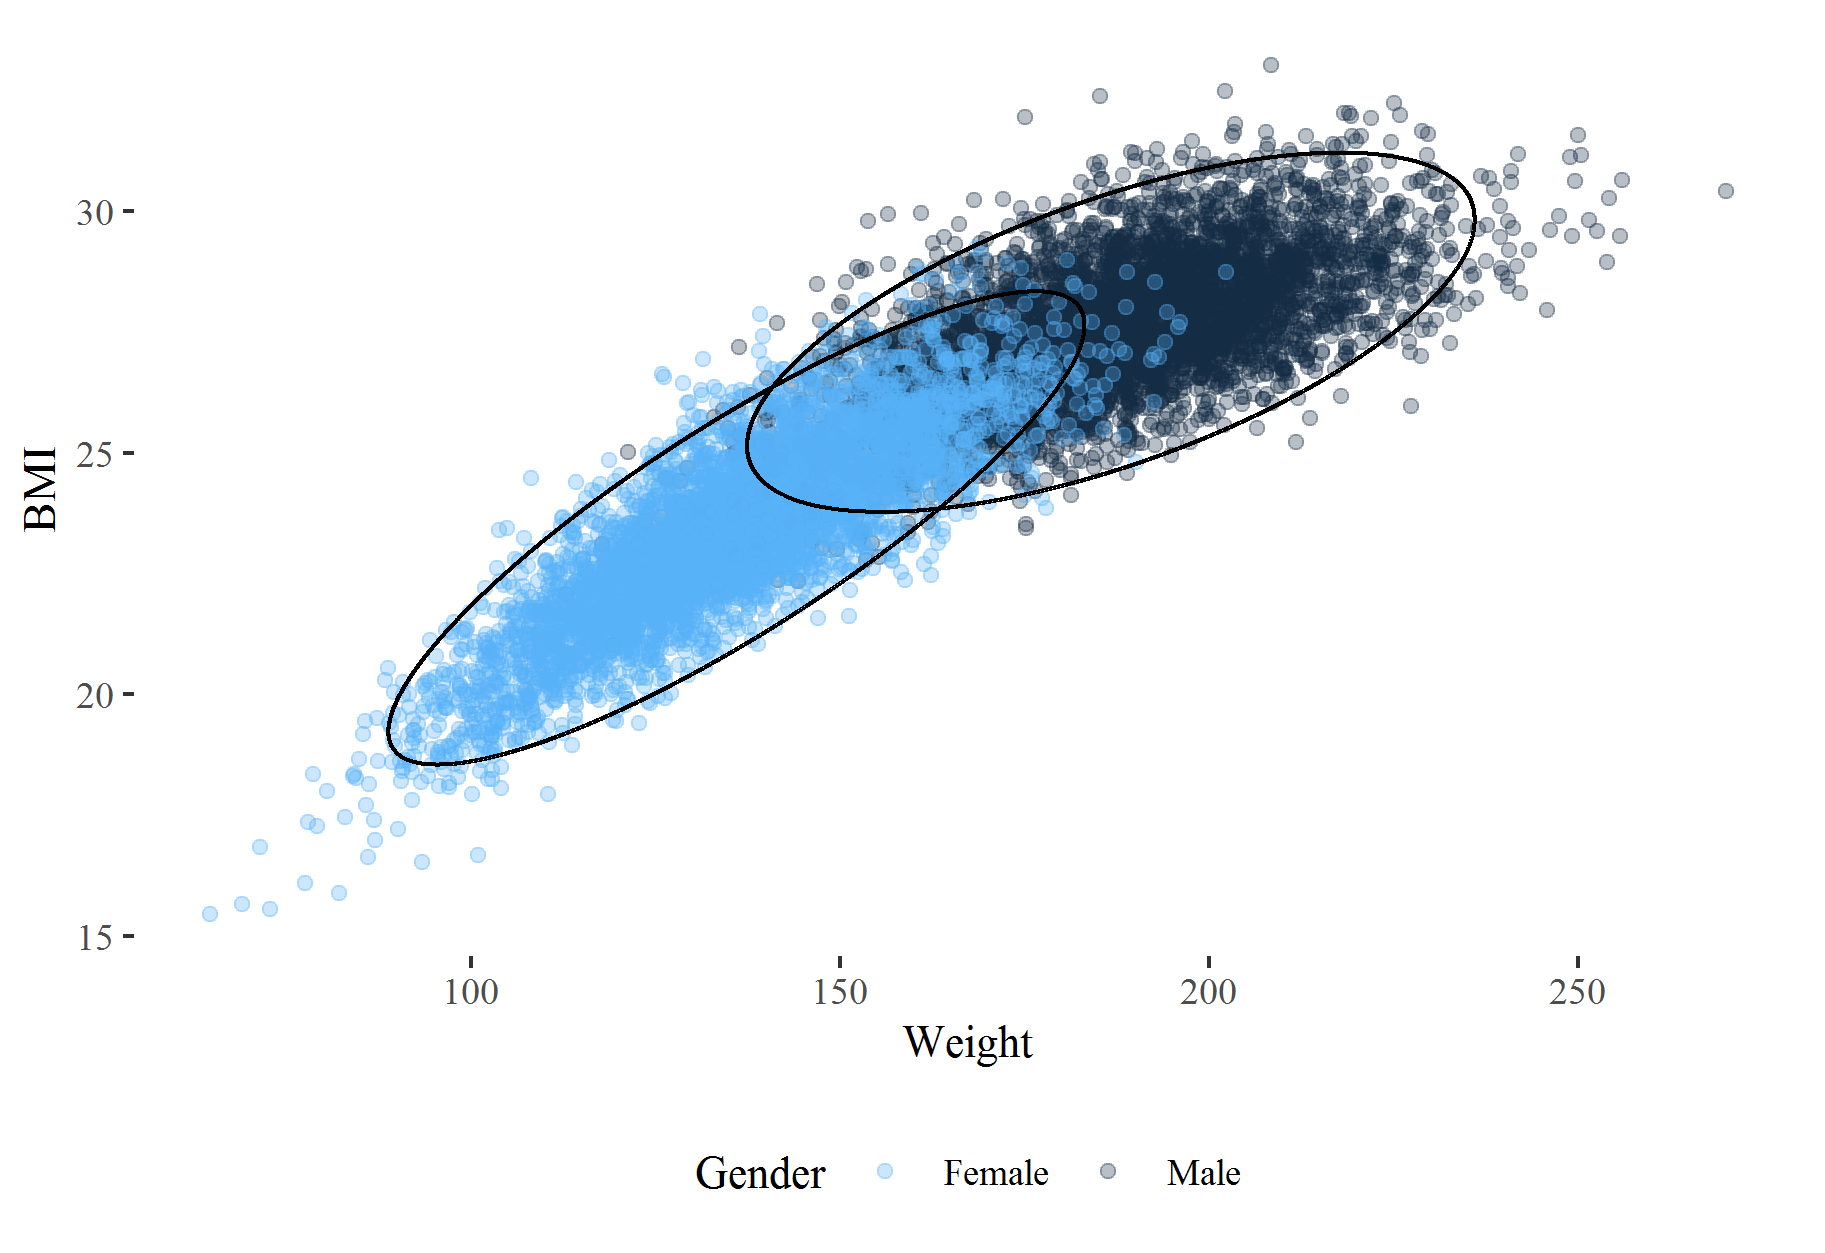
Mixture model to Gender dataset

Packages for fitting mixture models
mixtools- The Poisson distribution is not implemented.
bayesmix- Bayesian inference is outside the scope of the course.
EMCluster- Only Gaussian distributions.
flexmix- Has all the distributions we need and gives you the flexibility to perform more complex models.
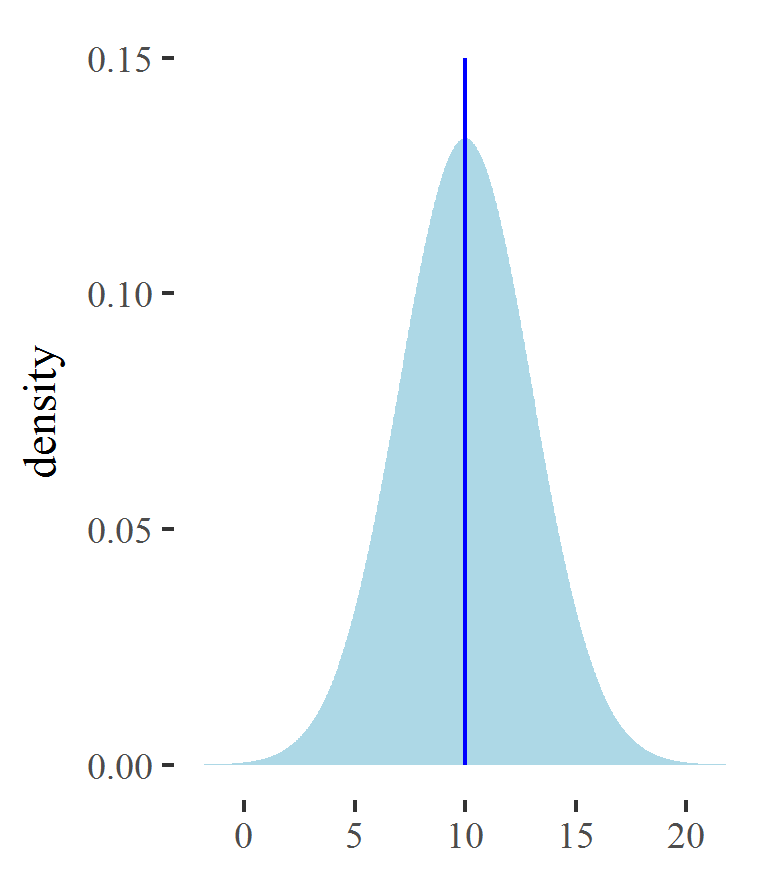
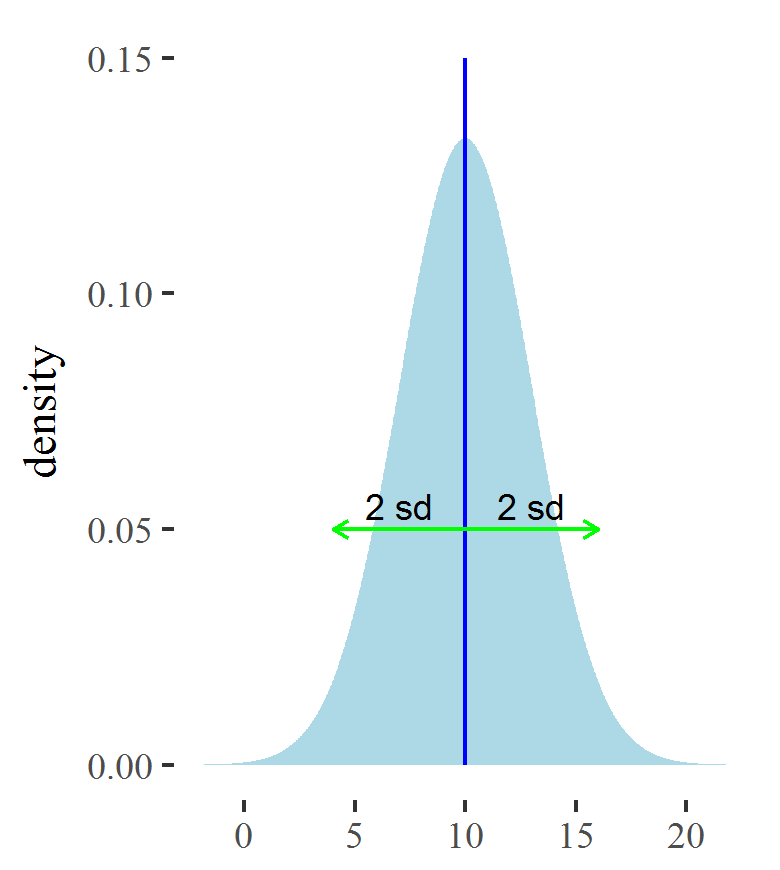
Properties of Gaussian distribution
Mean

Standard deviation

Sample from a Gaussian distribution
To generate samples from a Gaussian distribution:
rnorm(n, mean, sd)
Example: Generate 100 values from a Gaussian distribution with a mean of 10 and a standard deviation of 5
> population_sample <- rnorm(n = 100, mean = 10, sd = 5)
> head(population_sample)
[1] 6.248874 9.564190 16.006521 9.139647 10.114969 16.423538
Estimation of the mean
- Don't know the mean and the standard deviation, only know the observations
- Need to be estimated from the observations
- To estimate the mean, we can calculate the sample mean
> mean_estimate <- mean(population_sample)
10.35759
To estimate the sd, we perform the following procedure
$$value_i\rightarrow (. -mean\_estimate)\rightarrow (.)^2\rightarrow mean (.)\rightarrow \sqrt{(.)}$$
> population_sample %>%
+   subtract(mean_estimate) %>%
+   raise_to_power(2) %>% mean() %>% sqrt()
5.318641
- Using the
sdfunction
> standard_deviation_estimate <- sd(population_sample)
> standard_deviation_estimate
5.345435
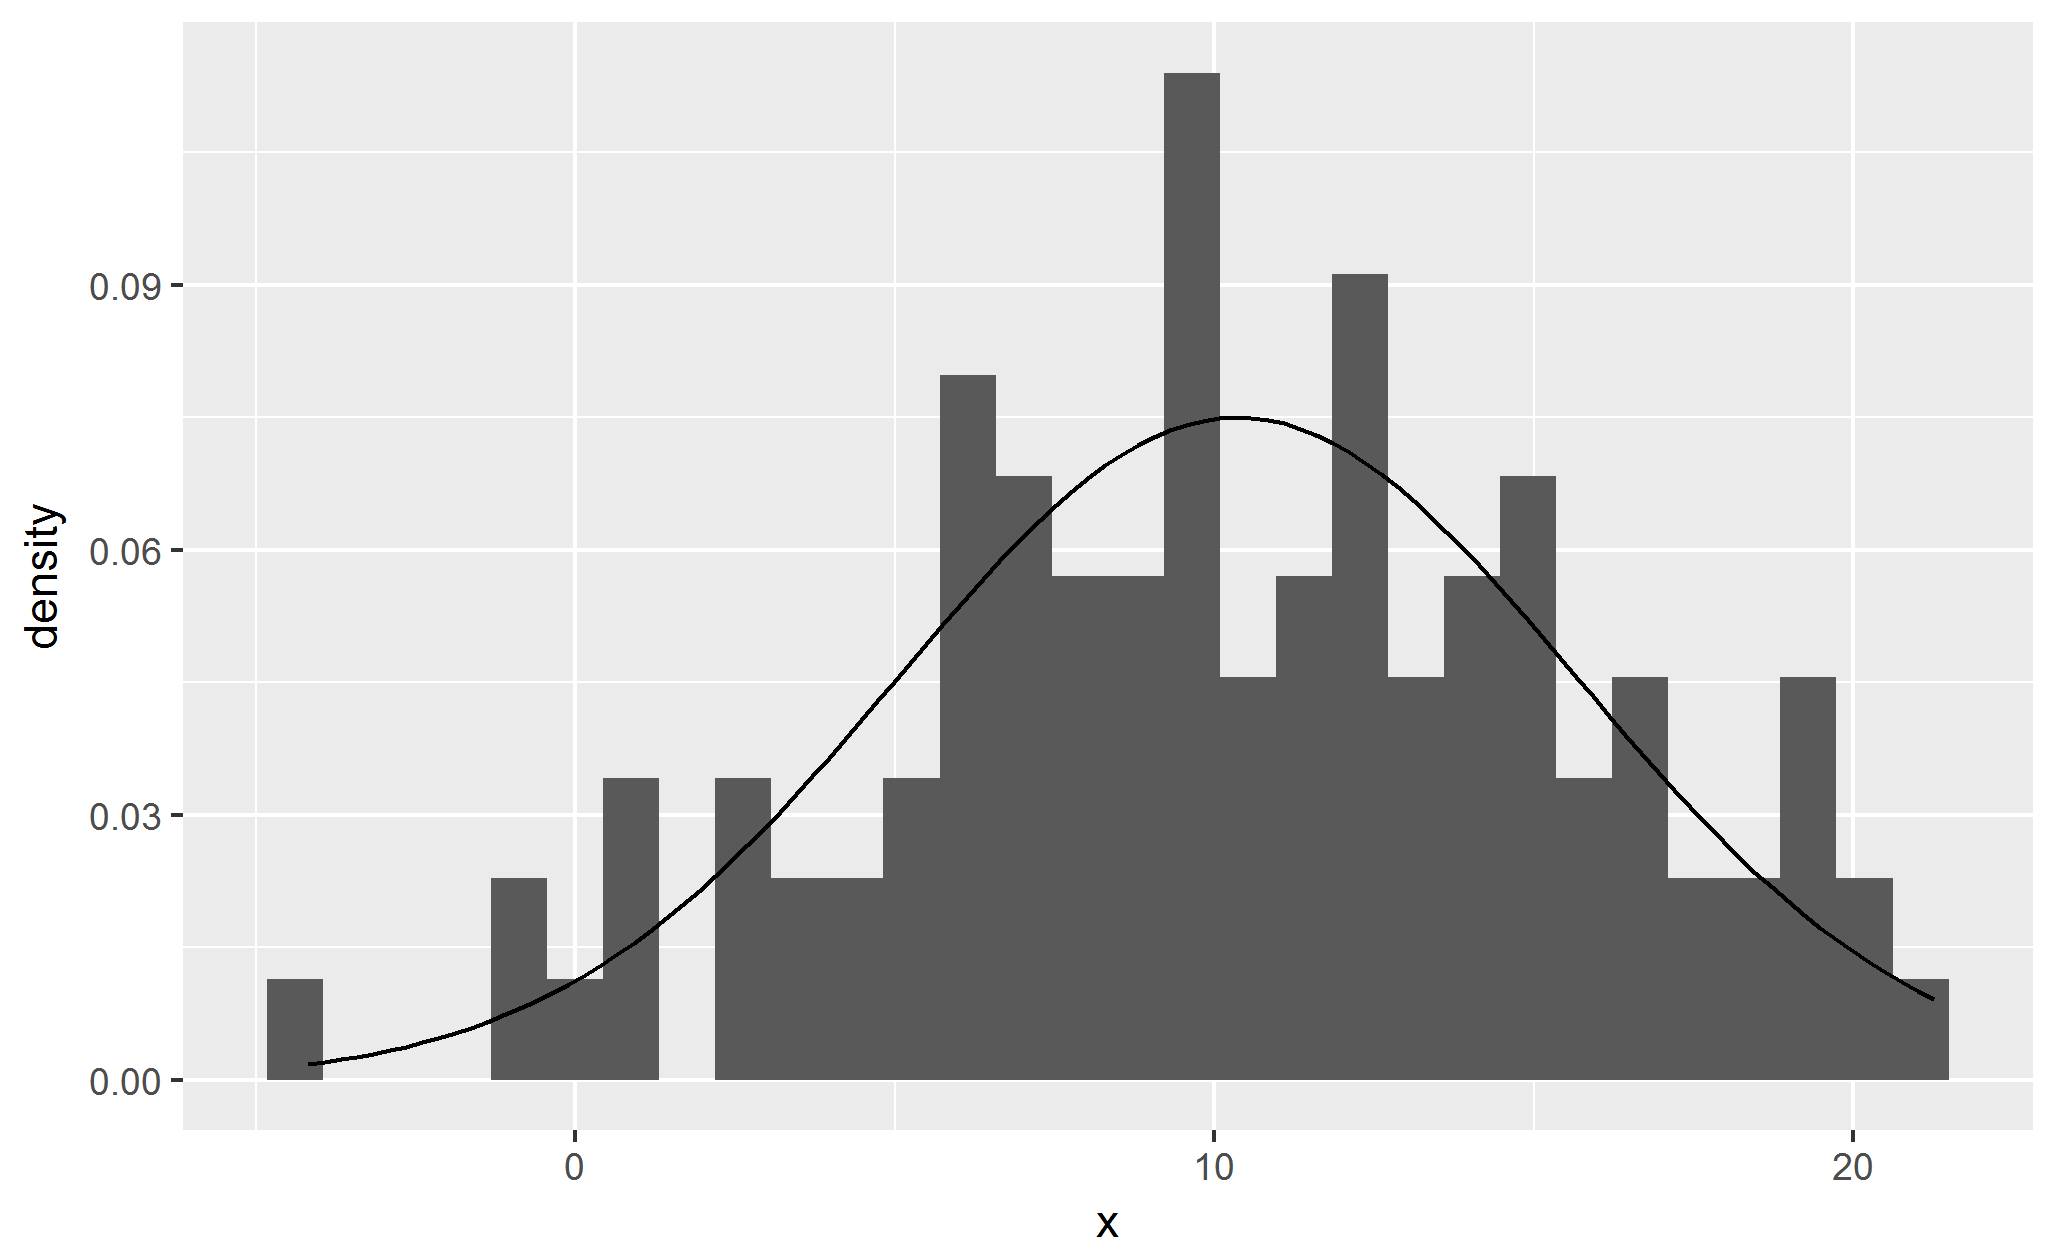
Visualizing the estimated Gaussian distribution
# Transform the sample into a data frame
population_sample <- data.frame(x = population_sample)

# Plot the histogram
ggplot(data = population_sample) +
   geom_histogram(aes(x = x, y = ..density..)) +
   stat_function(geom = "line",
                 fun = dnorm,
                 args = list(mean = mean_estimate,
                             sd = standard_deviation_estimate))

Let's practice!
Mixture Models in R

