Mixture Models in R
Victor Medina
Researcher at The University of Edinburgh
Covariance matrices without cross-terms
fit_without_cov <- flexmix(cbind(Weight, BMI) ~ 1,
                k = 2,
                data = gender,
                model = FLXMCmvnorm(diag = TRUE),
                control = list(tolerance = 1e-15, iter.max = 1000))
Weight ~ 1
cbind(Weight, BMI) ~ 1
FLXMCnorm1()
FLXMCmvnorm(diag = TRUE)
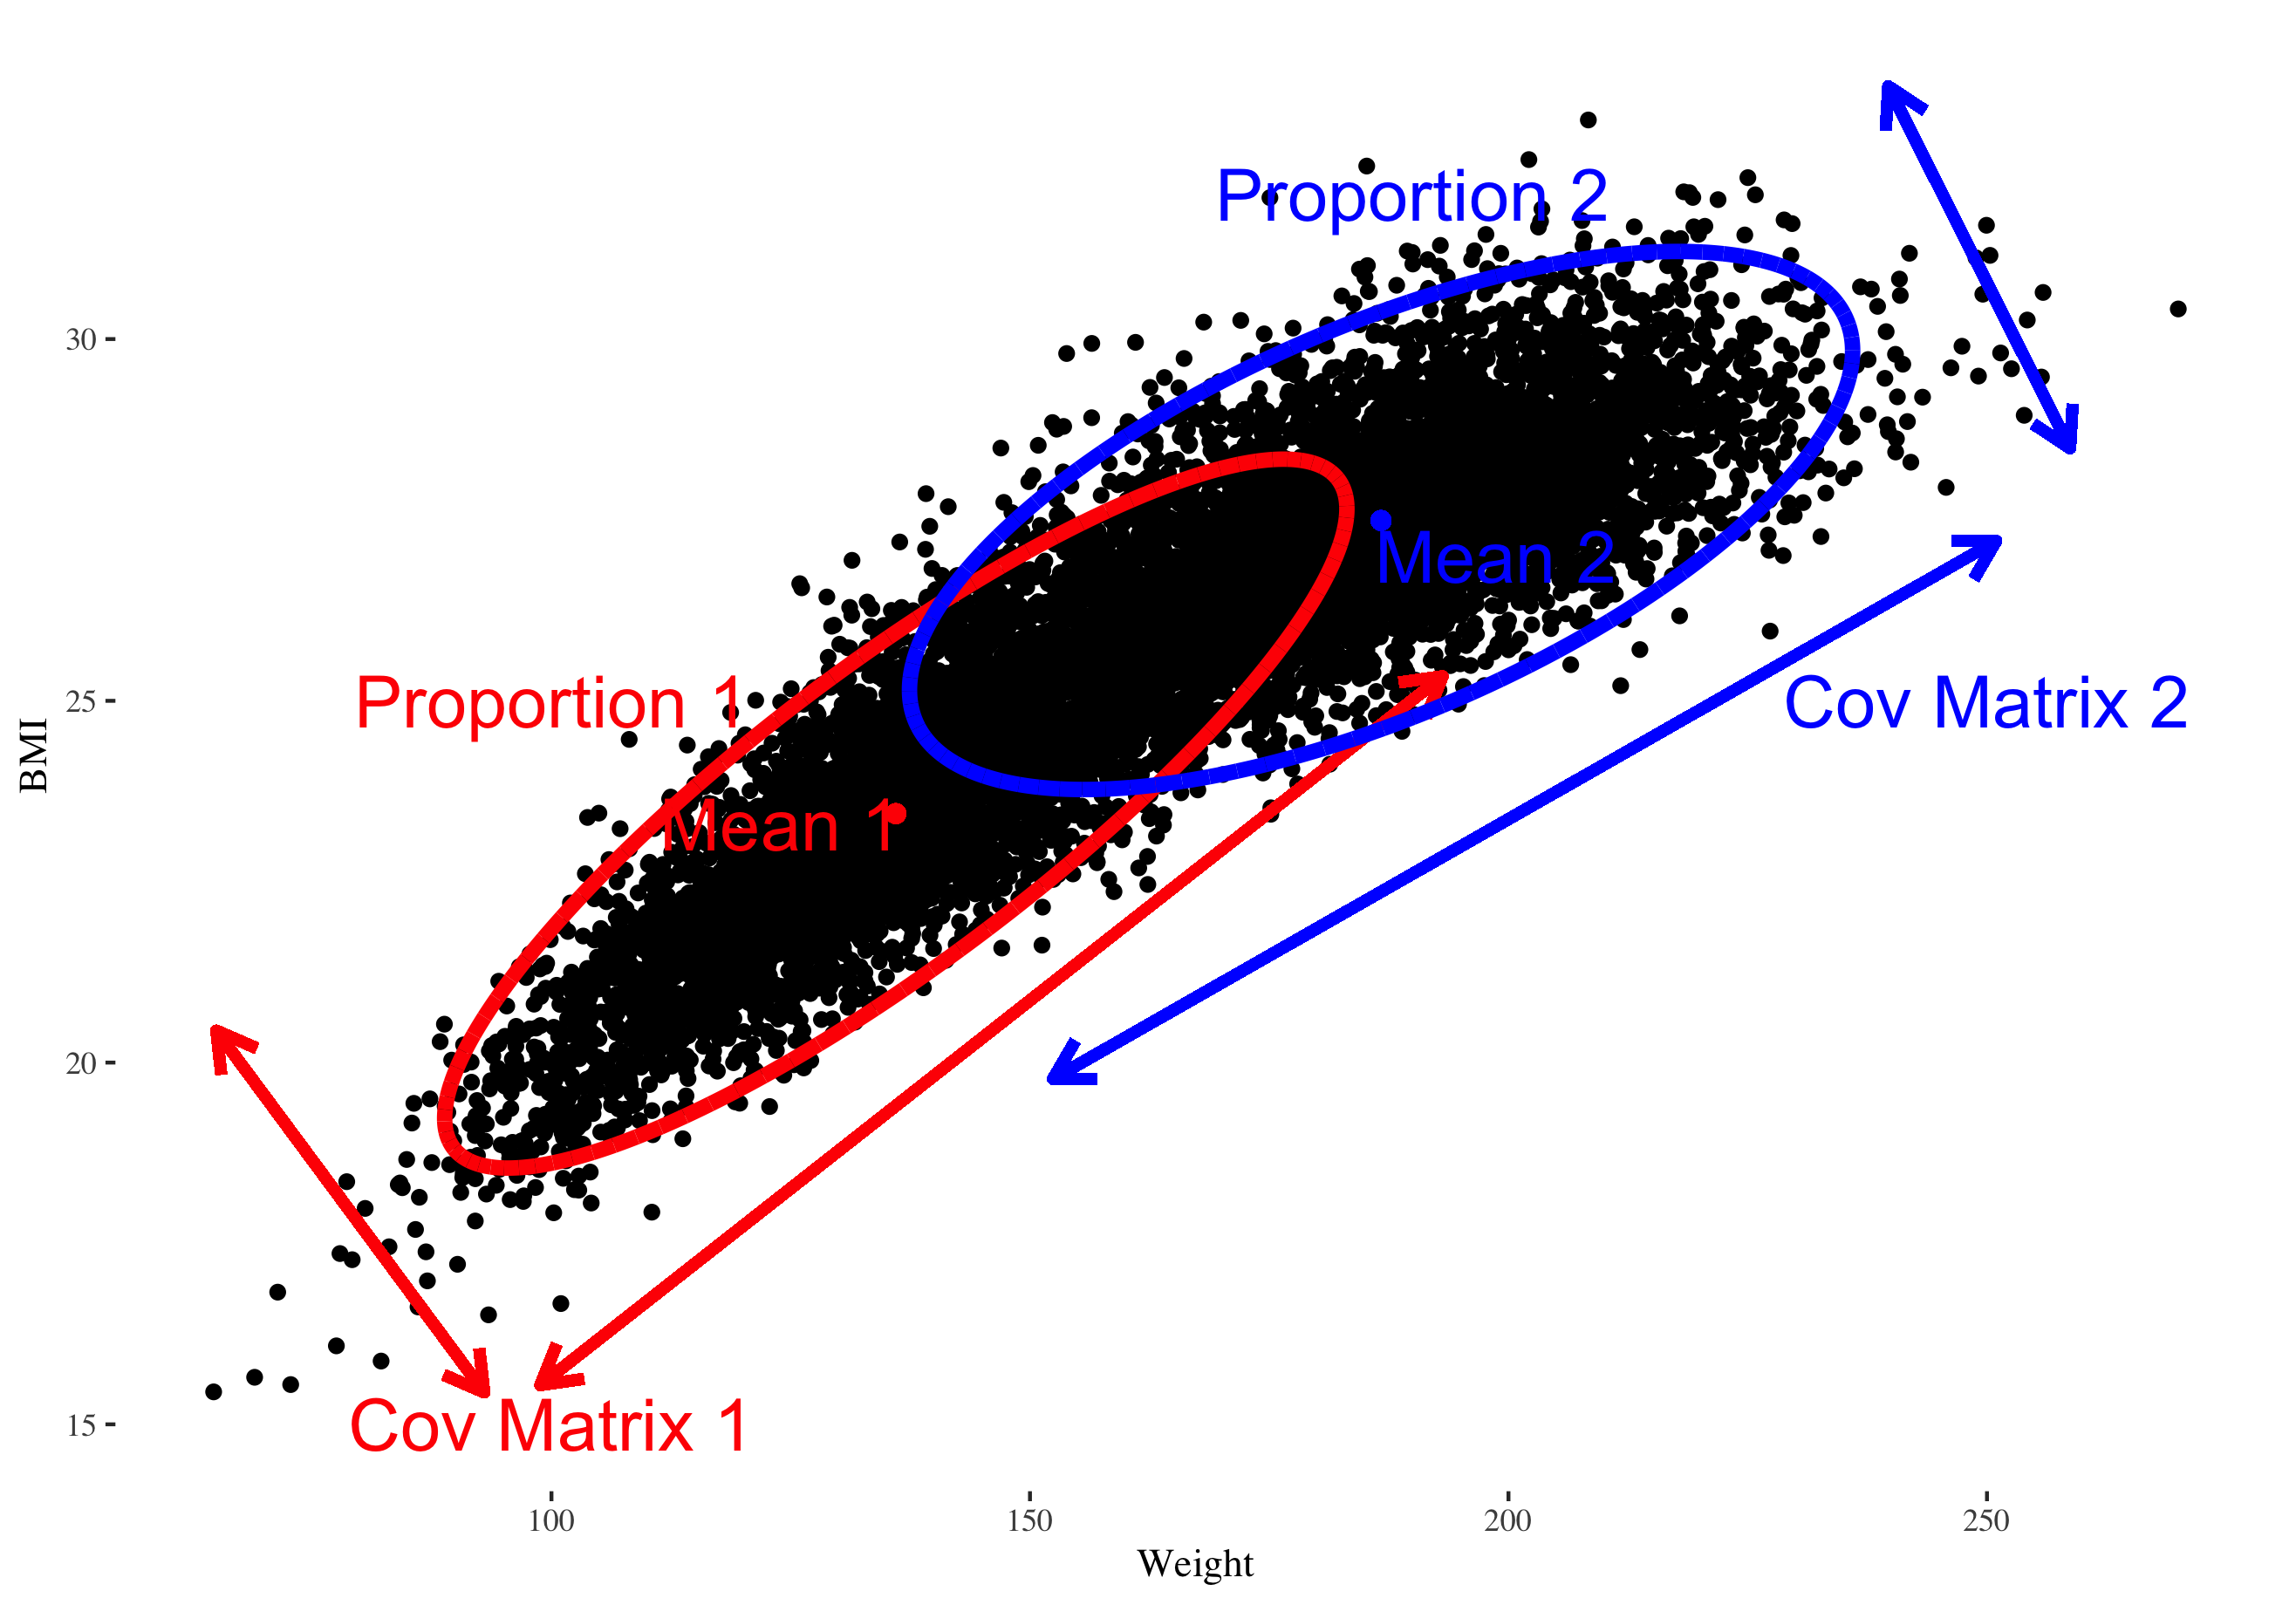
proportions <- prior(fit_without_cov)
proportions
0.5314674 0.4685326
parameters(fit_without_cov)
                  Comp.1     Comp.2
center.Weight 186.309154 133.231102
center.BMI     27.521840  23.154197
cov1          366.830490 286.899357
cov2            0.000000   0.000000
cov3            0.000000   0.000000
cov4            2.012768   3.065863
# Extract each component
comp_1 <- parameters(fit_without_corr, component=1)
comp_2 <- parameters(fit_without_corr, component=2)

# Extract the means
mean_comp_1 <- comp_1[1:2]
mean_comp_2 <- comp_2[1:2]
# Extract each component comp_1 <- parameters(fit_without_corr, component=1) comp_2 <- parameters(fit_without_corr, component=2)
# Extract the means mean_comp_1 <- comp_1[1:2] mean_comp_2 <- comp_2[1:2]
mean_comp_1
186.30915 27.52184
> mean_comp_2
133.2311 23.1542
# Extract the covariance matrices
covariance_comp_1 <- matrix(comp_1[3:6], nrow=2)
covariance_comp_2 <- matrix(comp_2[3:6], nrow=2)
covariance_comp_1
         [,1]     [,2]
[1,] 366.8305 0.000000
[2,]   0.0000 2.012768
covariance_comp_2
         [,1]     [,2]
[1,] 286.8994 0.000000
[2,]   0.0000 3.065863
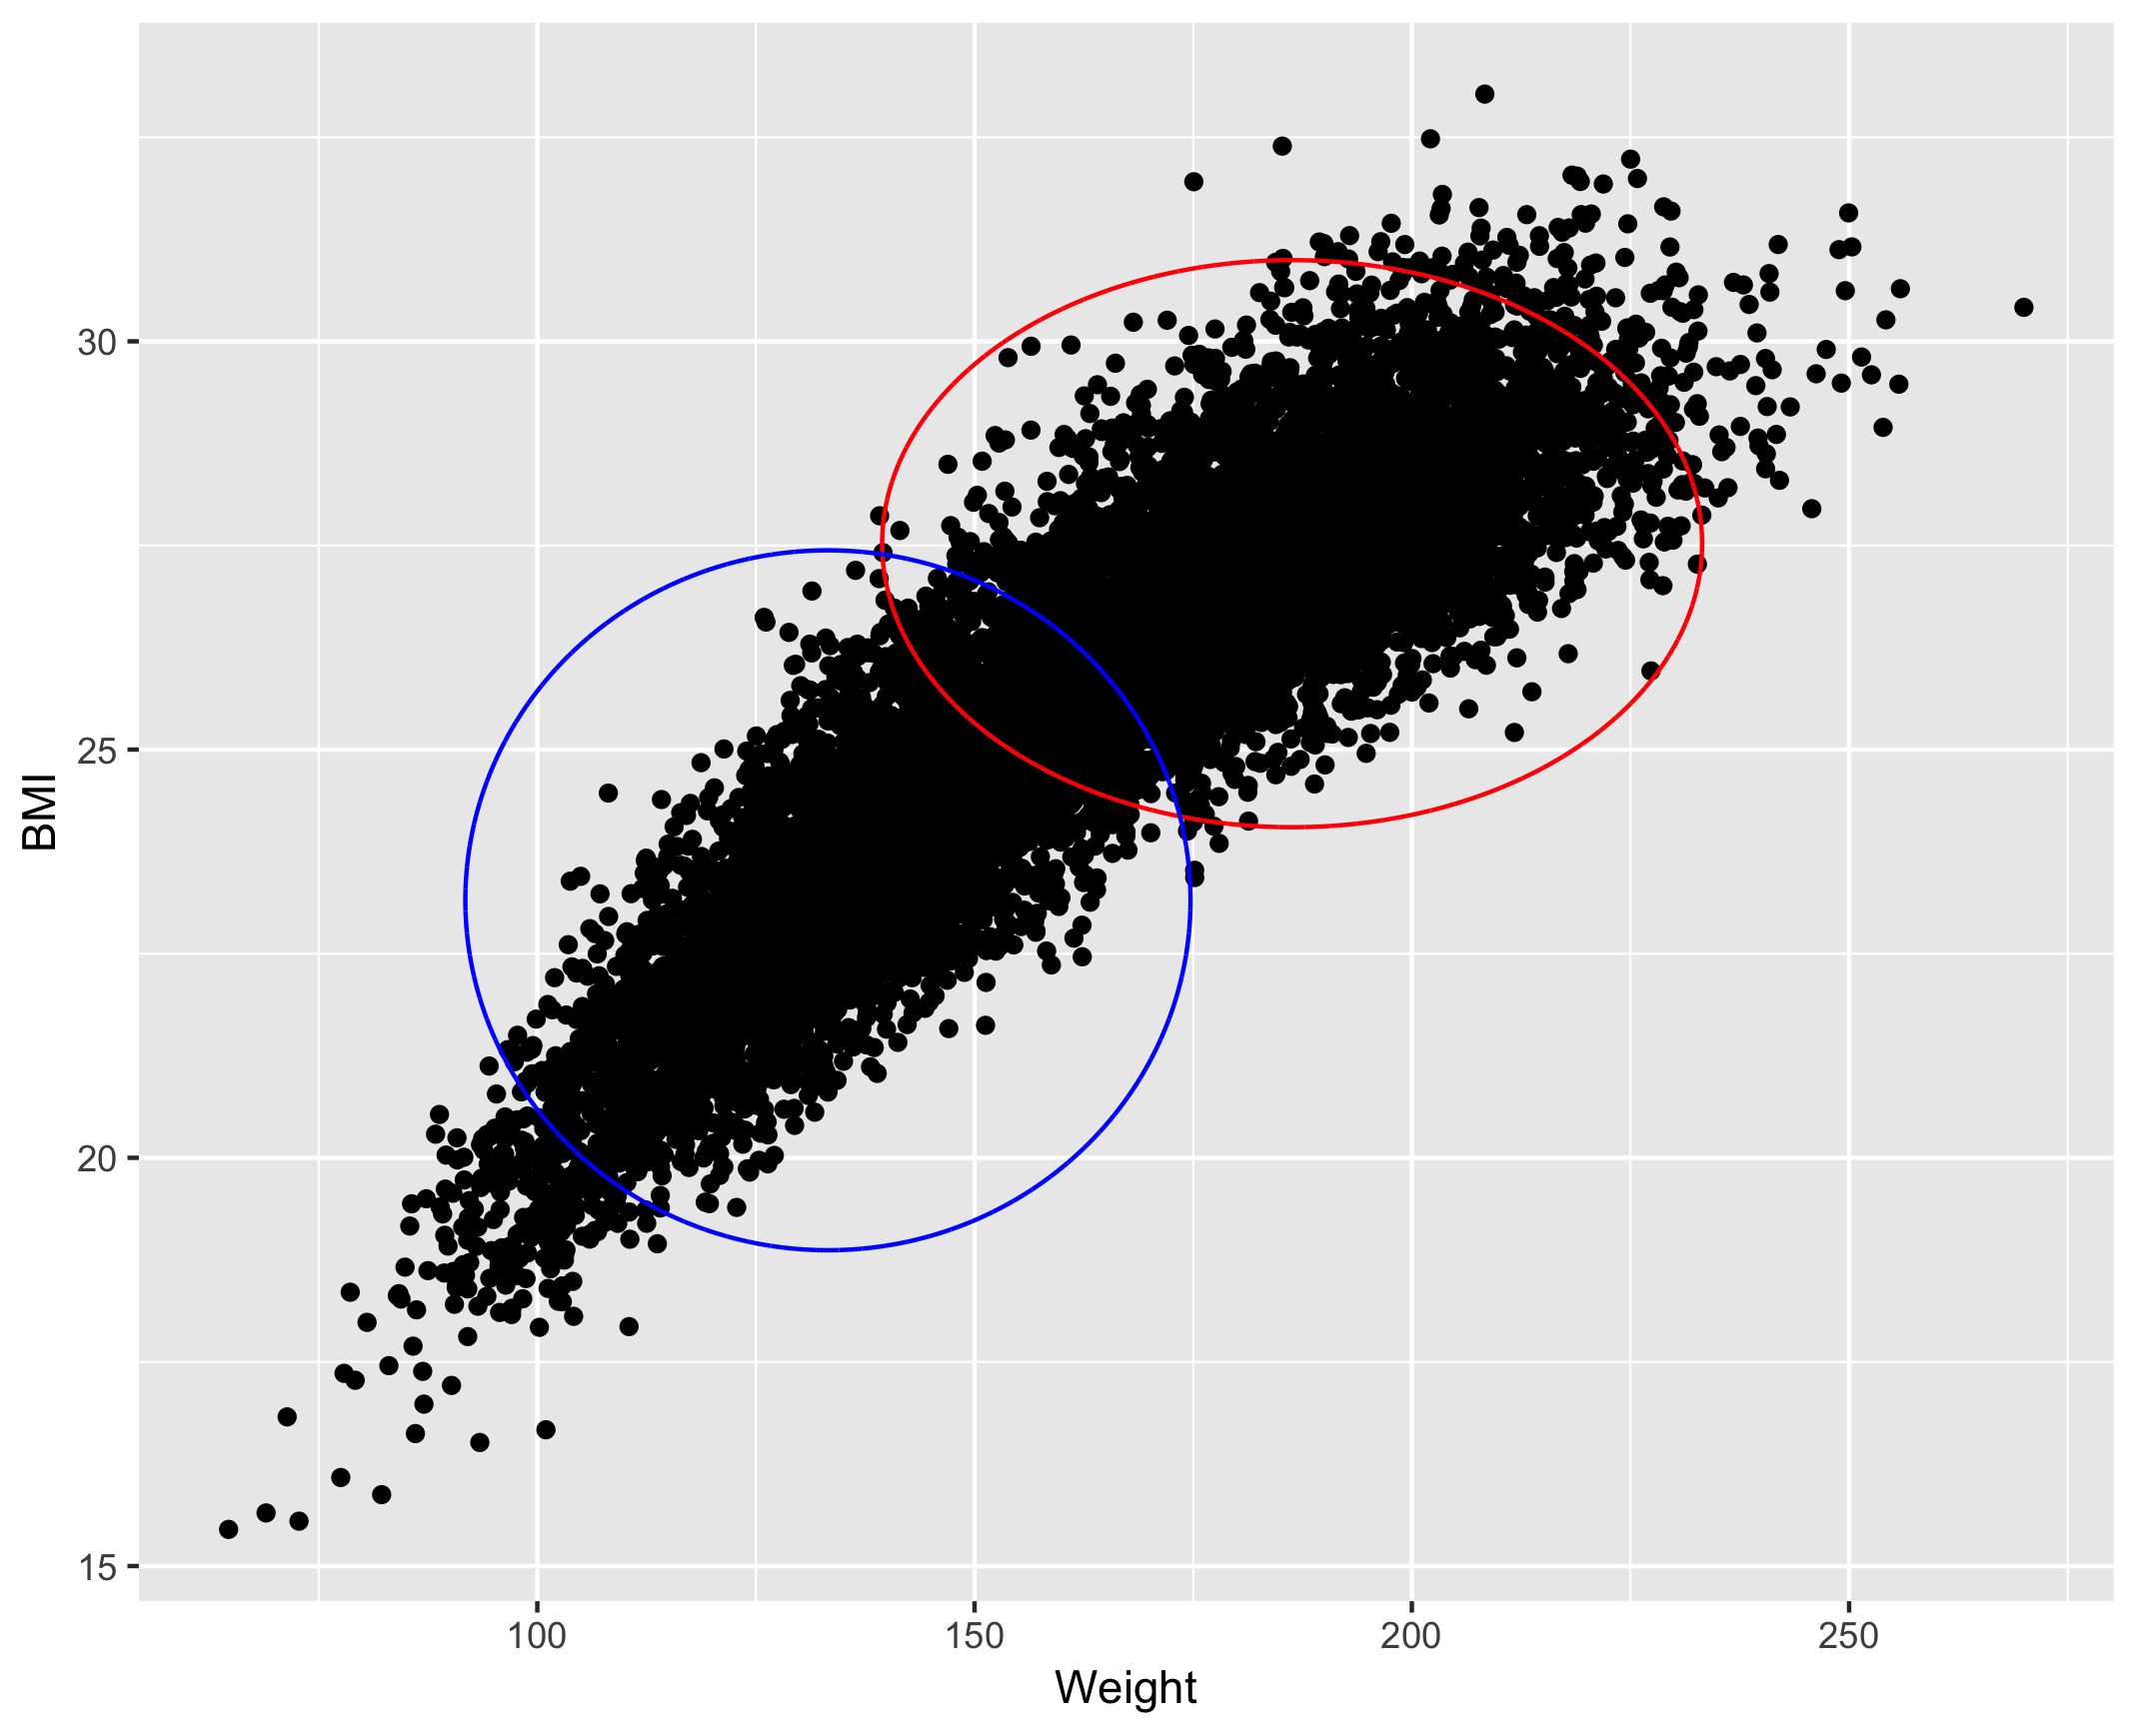
library(ellipse)
# ellipse curve for component 1
ellipse_comp_1 <- ellipse(x = covariance_comp_1,
                           centre = mean_comp_1,
                           npoints = nrow(gender))
# ellipse curve for component 2
ellipse_comp_2 <- ellipse(x = covariance_comp_2,
                           centre = mean_comp_2,
                           npoints = nrow(gender))
> head(ellipse_comp_1)
            x          y
[1,] 219.4592 29.97739
[2,] 219.4384 29.97893
[3,] 219.4175 29.98047
[4,] 219.3967 29.98201
[5,] 219.3758 29.98355
[6,] 219.3549 29.98509
gender %>%
   ggplot(aes(x = Weight, y = BMI)) + geom_point() +
   geom_path(data = data.frame(ellipse_comp_1), aes(x=x,y=y), col = "red") +
   geom_path(data = data.frame(ellipse_comp_2), aes(x=x,y=y), col = "blue")
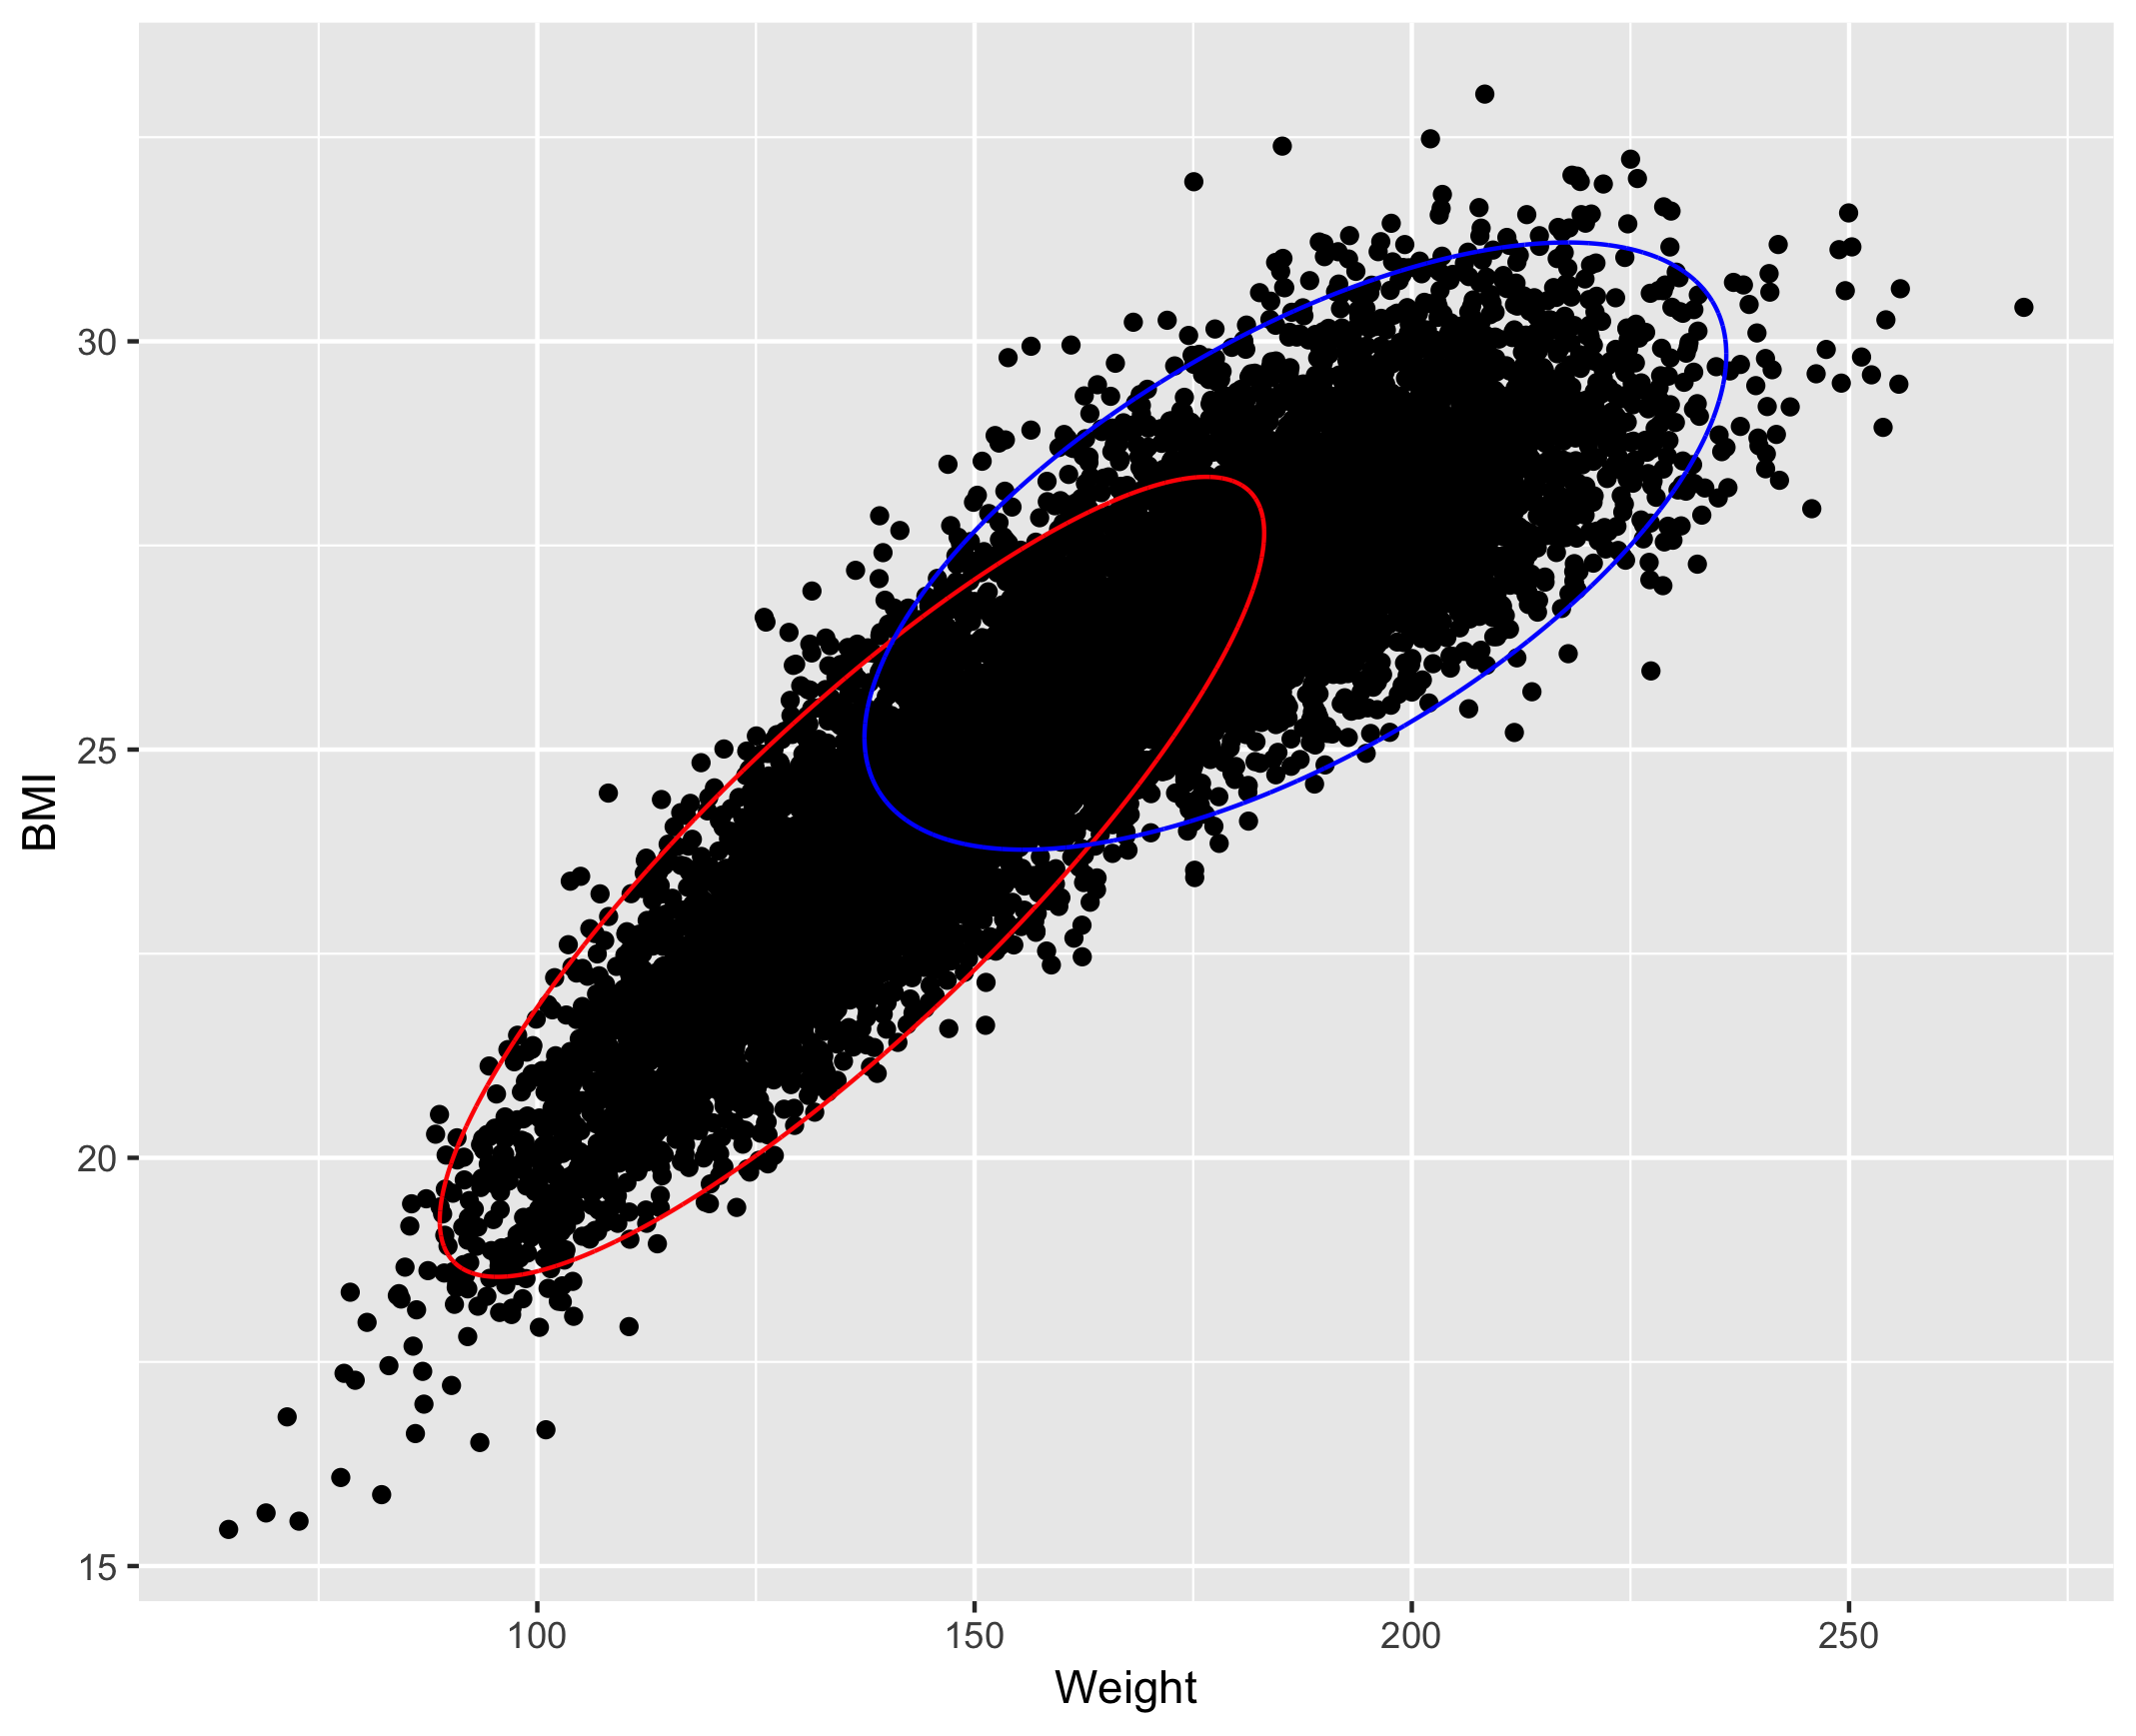
Covariance matrices with cross-terms
fit_with_corr <- flexmix(cbind(Weight,BMI) ~ 1,
                k = 2,
                data = gender,
                model = FLXMCmvnorm(diag = FALSE),
                control = list(tolerance = 1e-15, iter.max = 1000))