Univariate Gaussian Mixture Models
Mixture Models in R

Victor Medina
Researcher at The University of Edinburgh
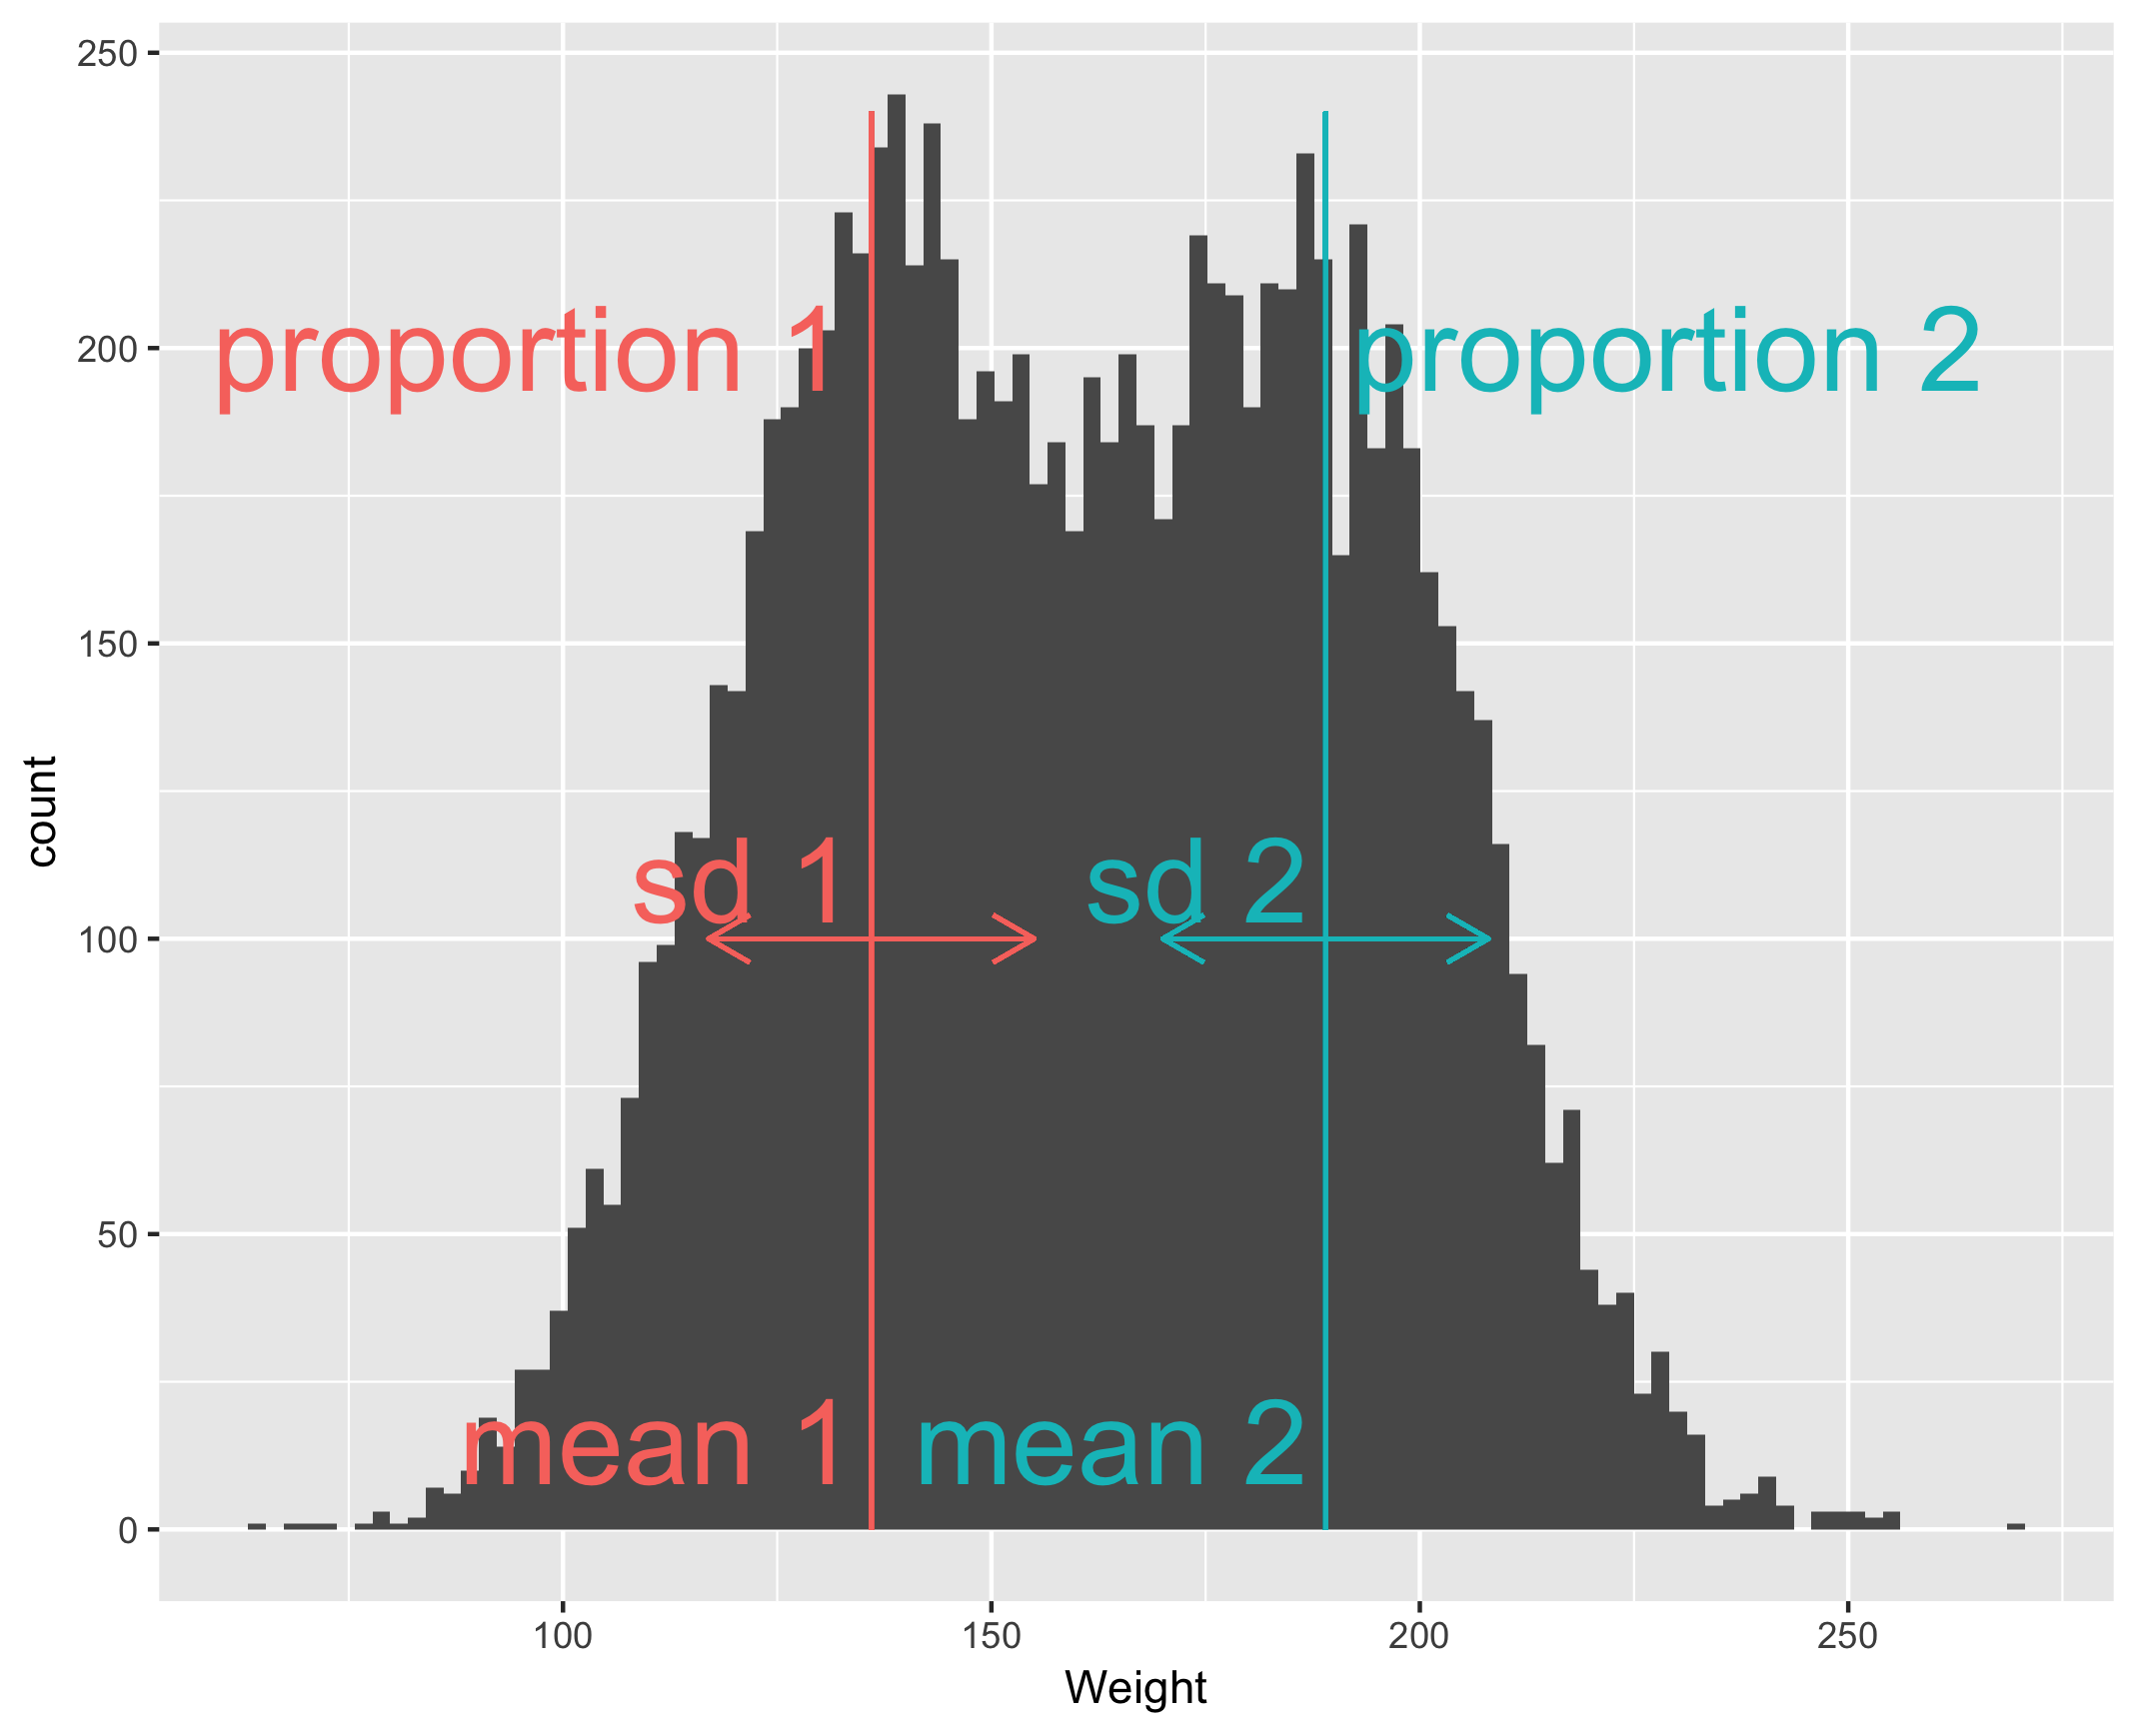
gender %>%
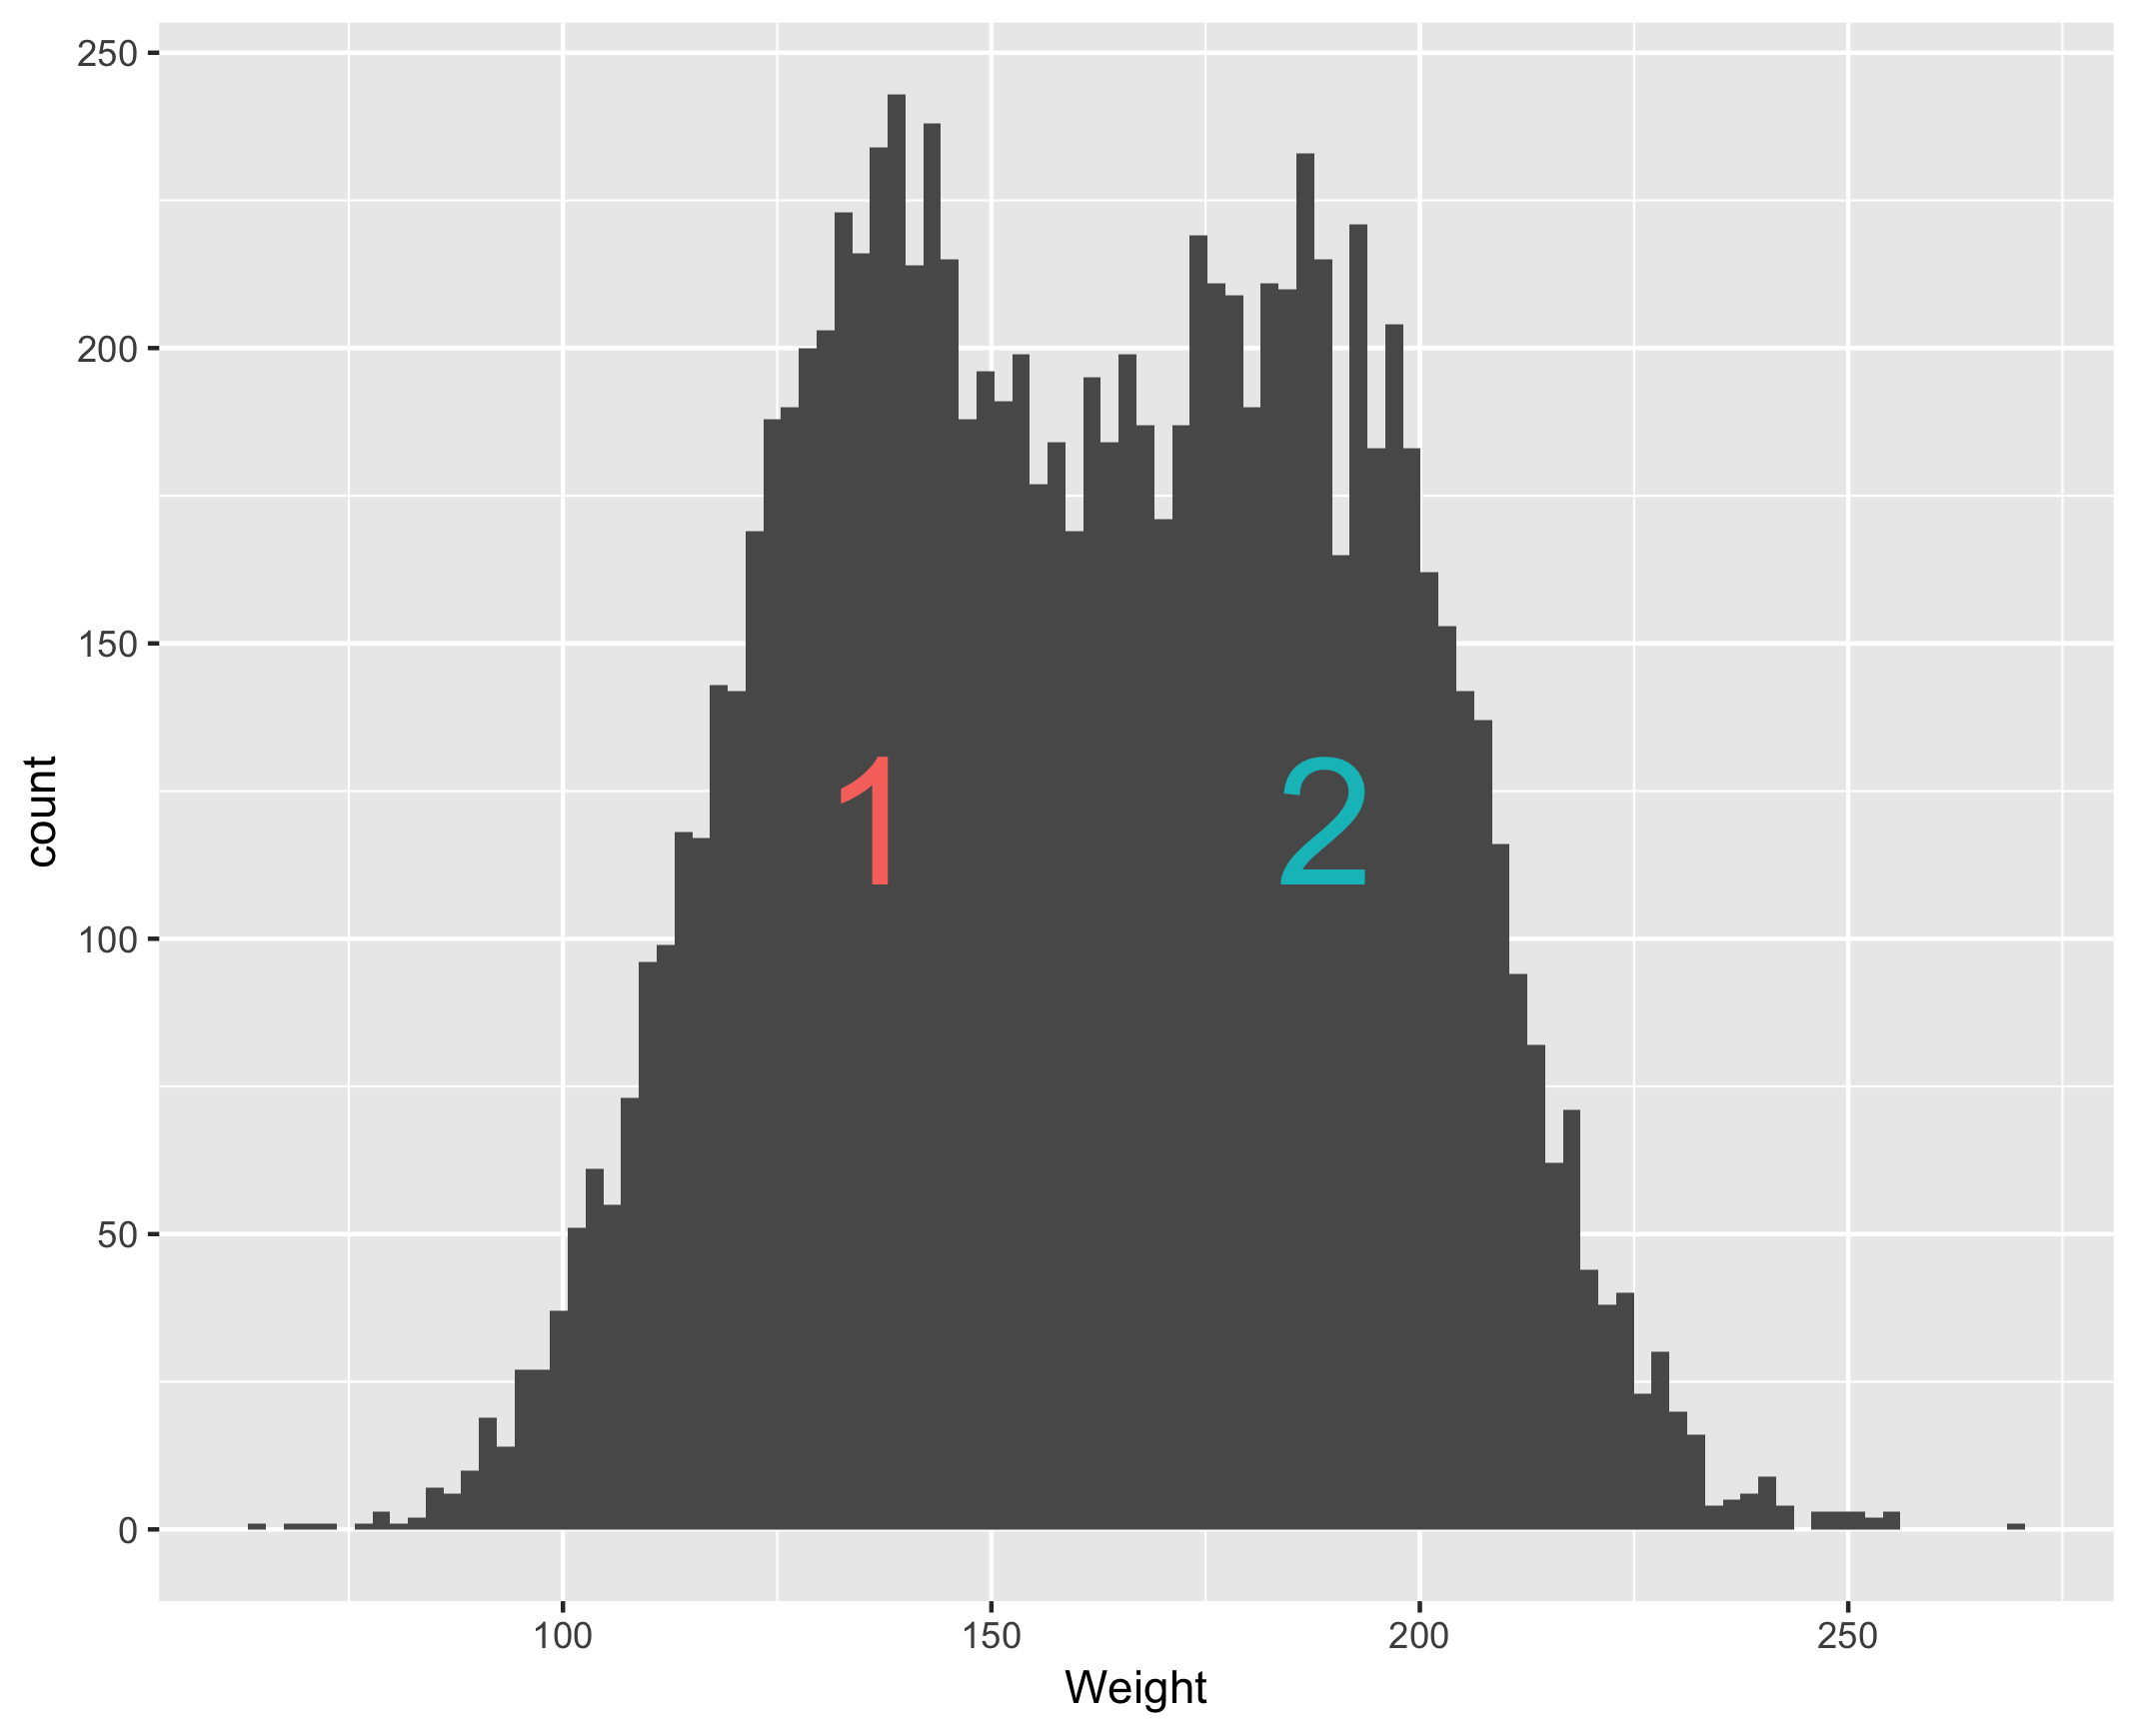
ggplot(aes(x = Weight)) + geom_histogram(bins = 100)
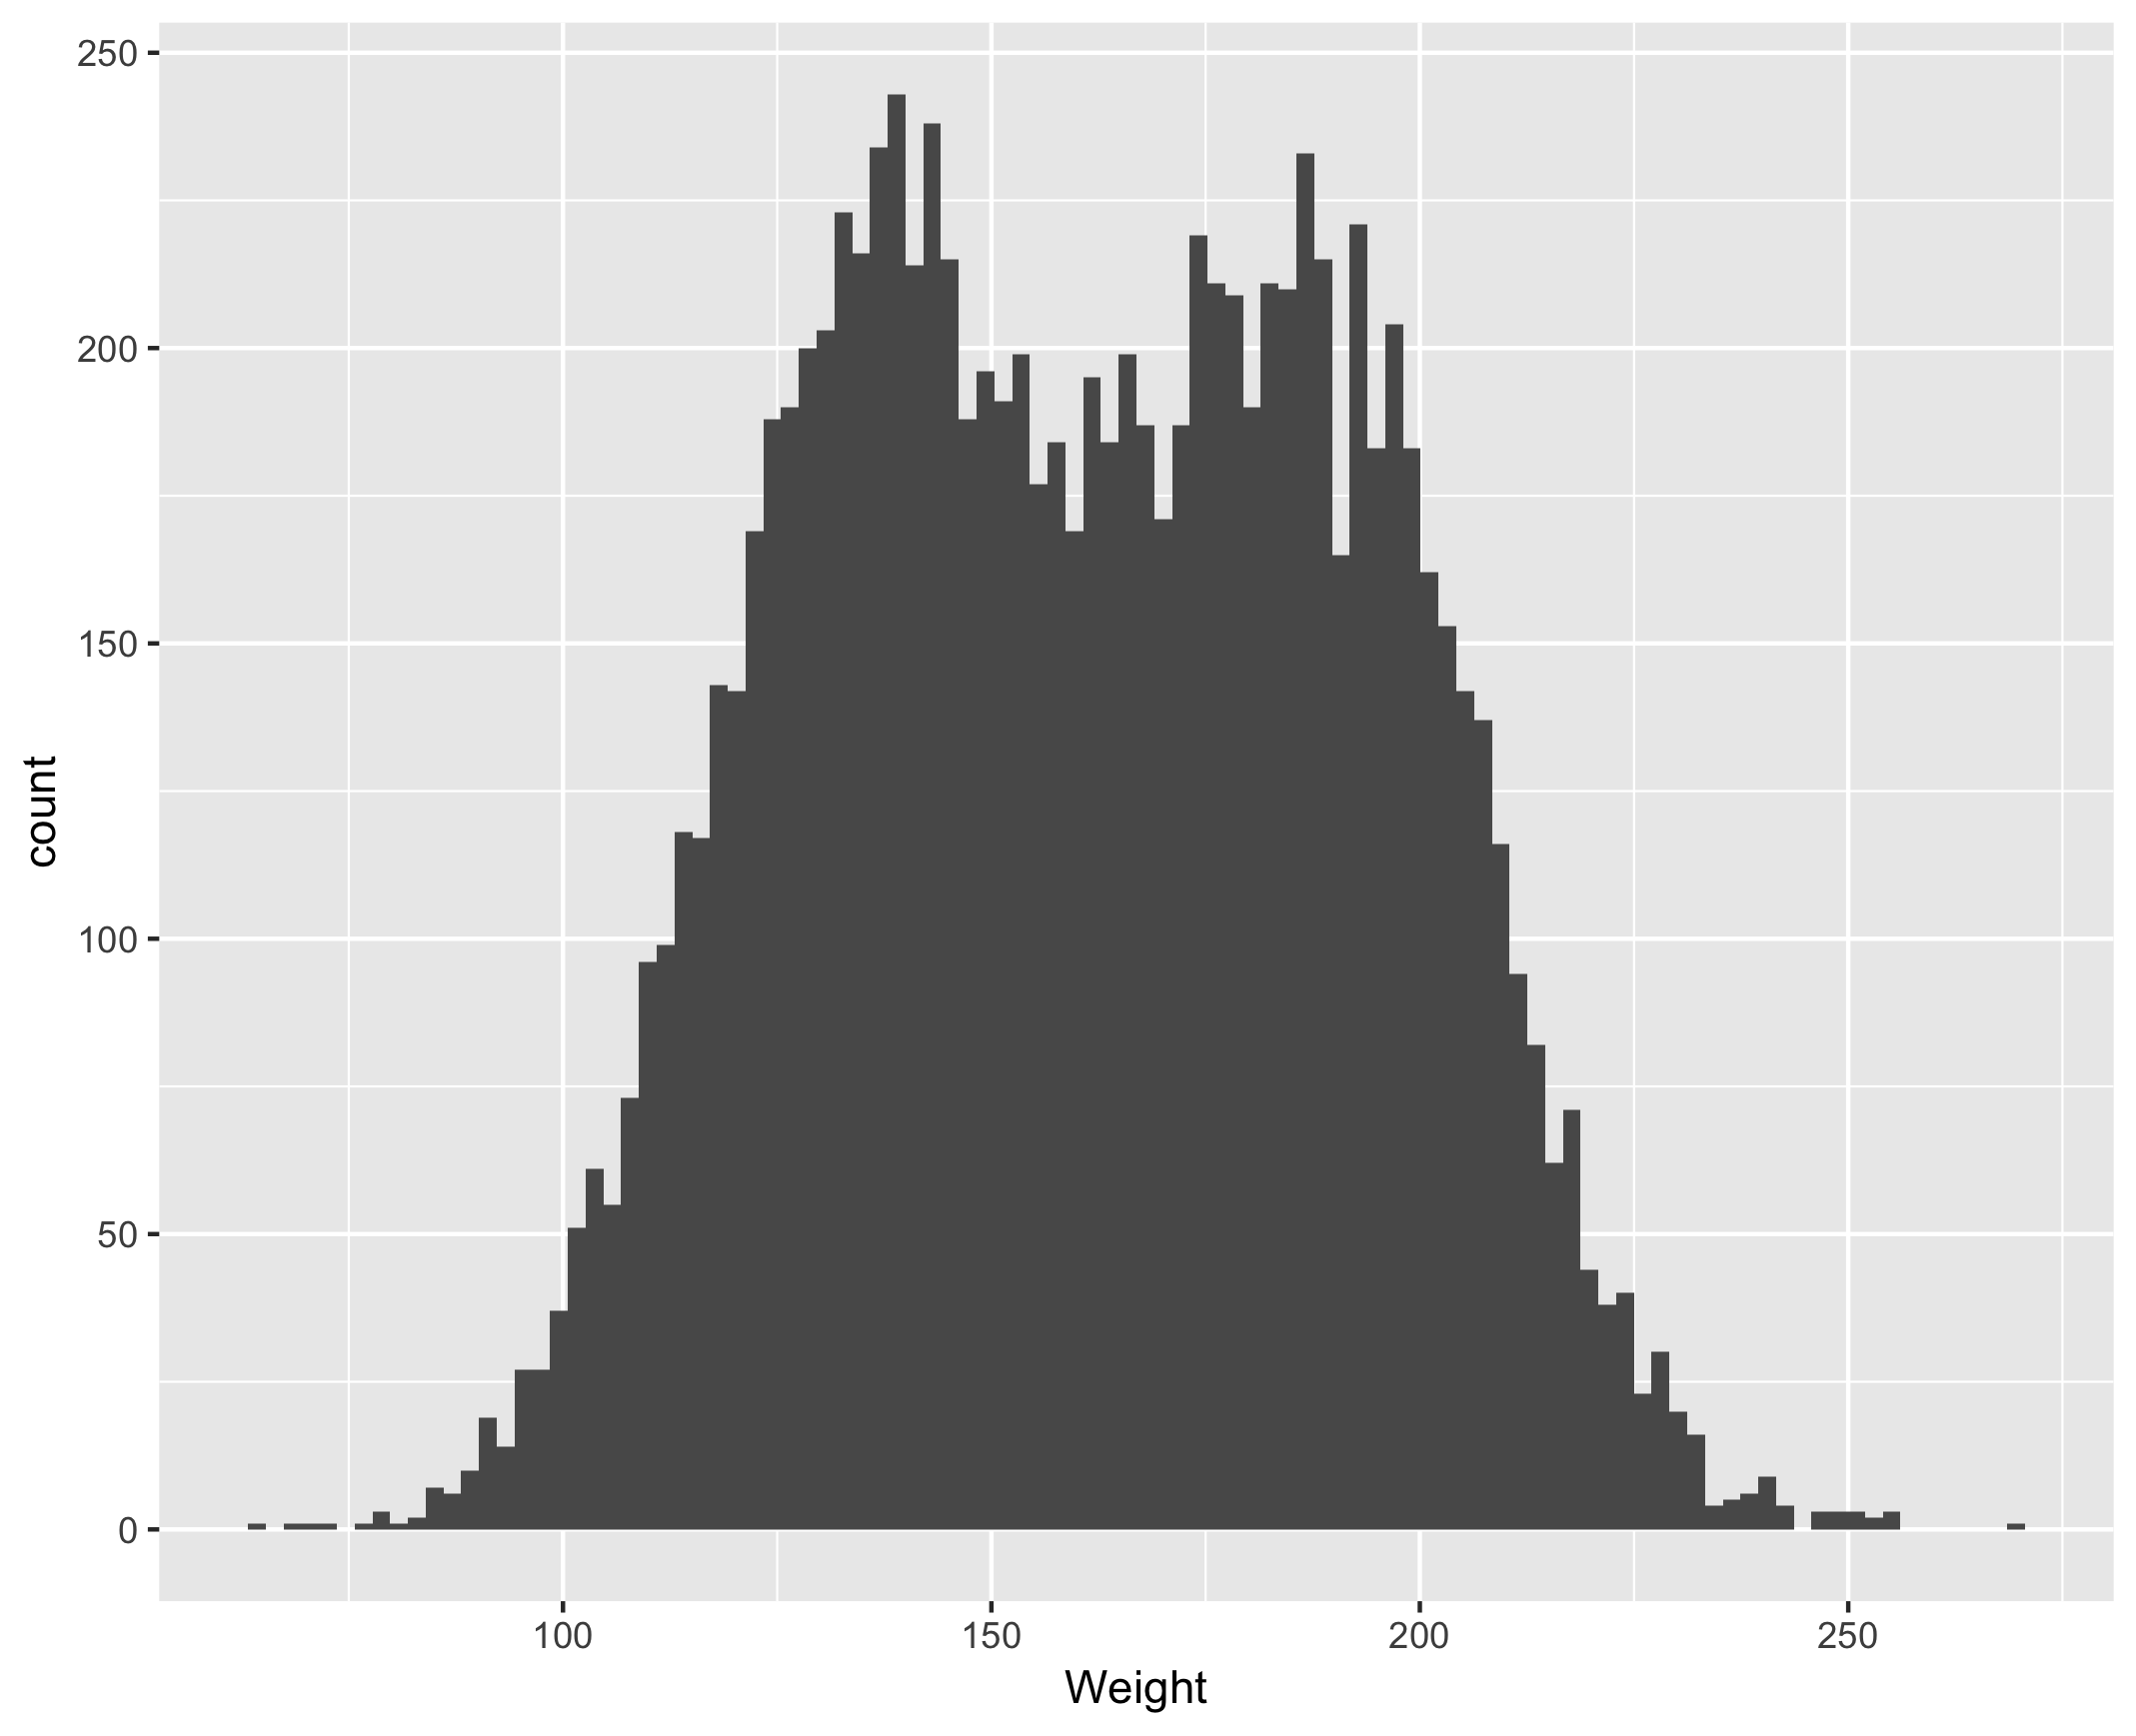
Which distribution?
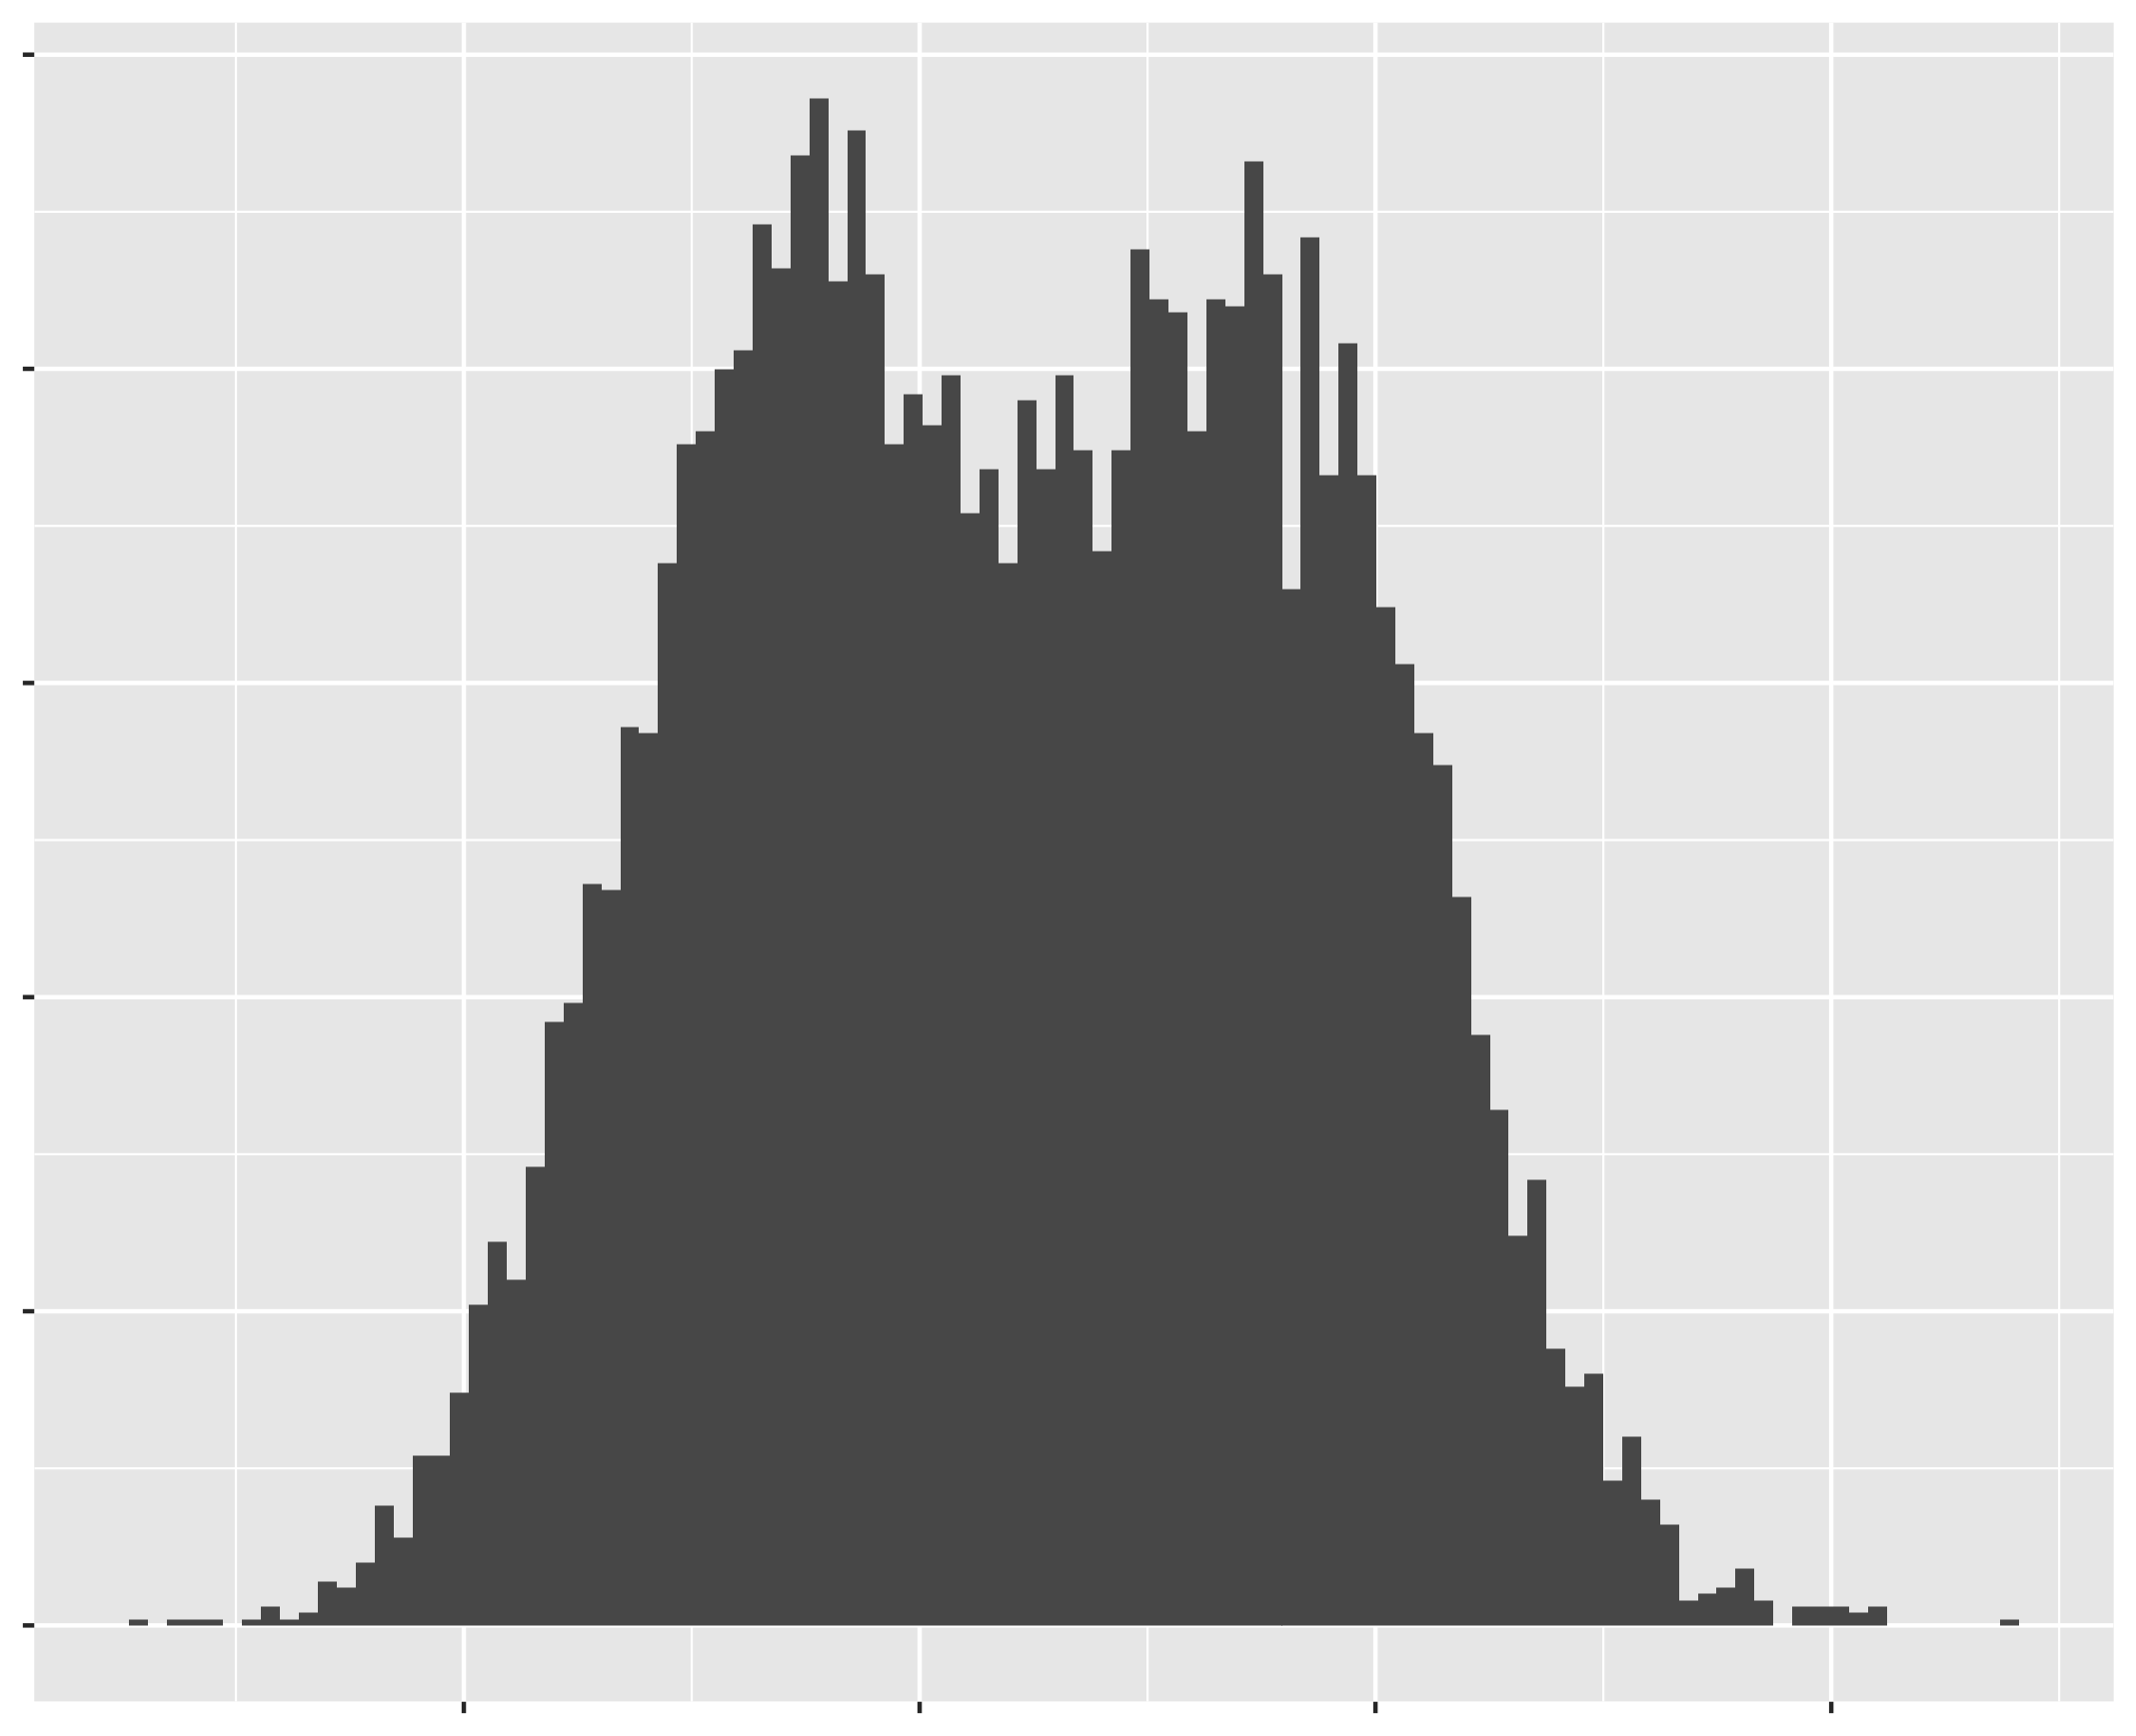
Histogram
Gaussian distributions
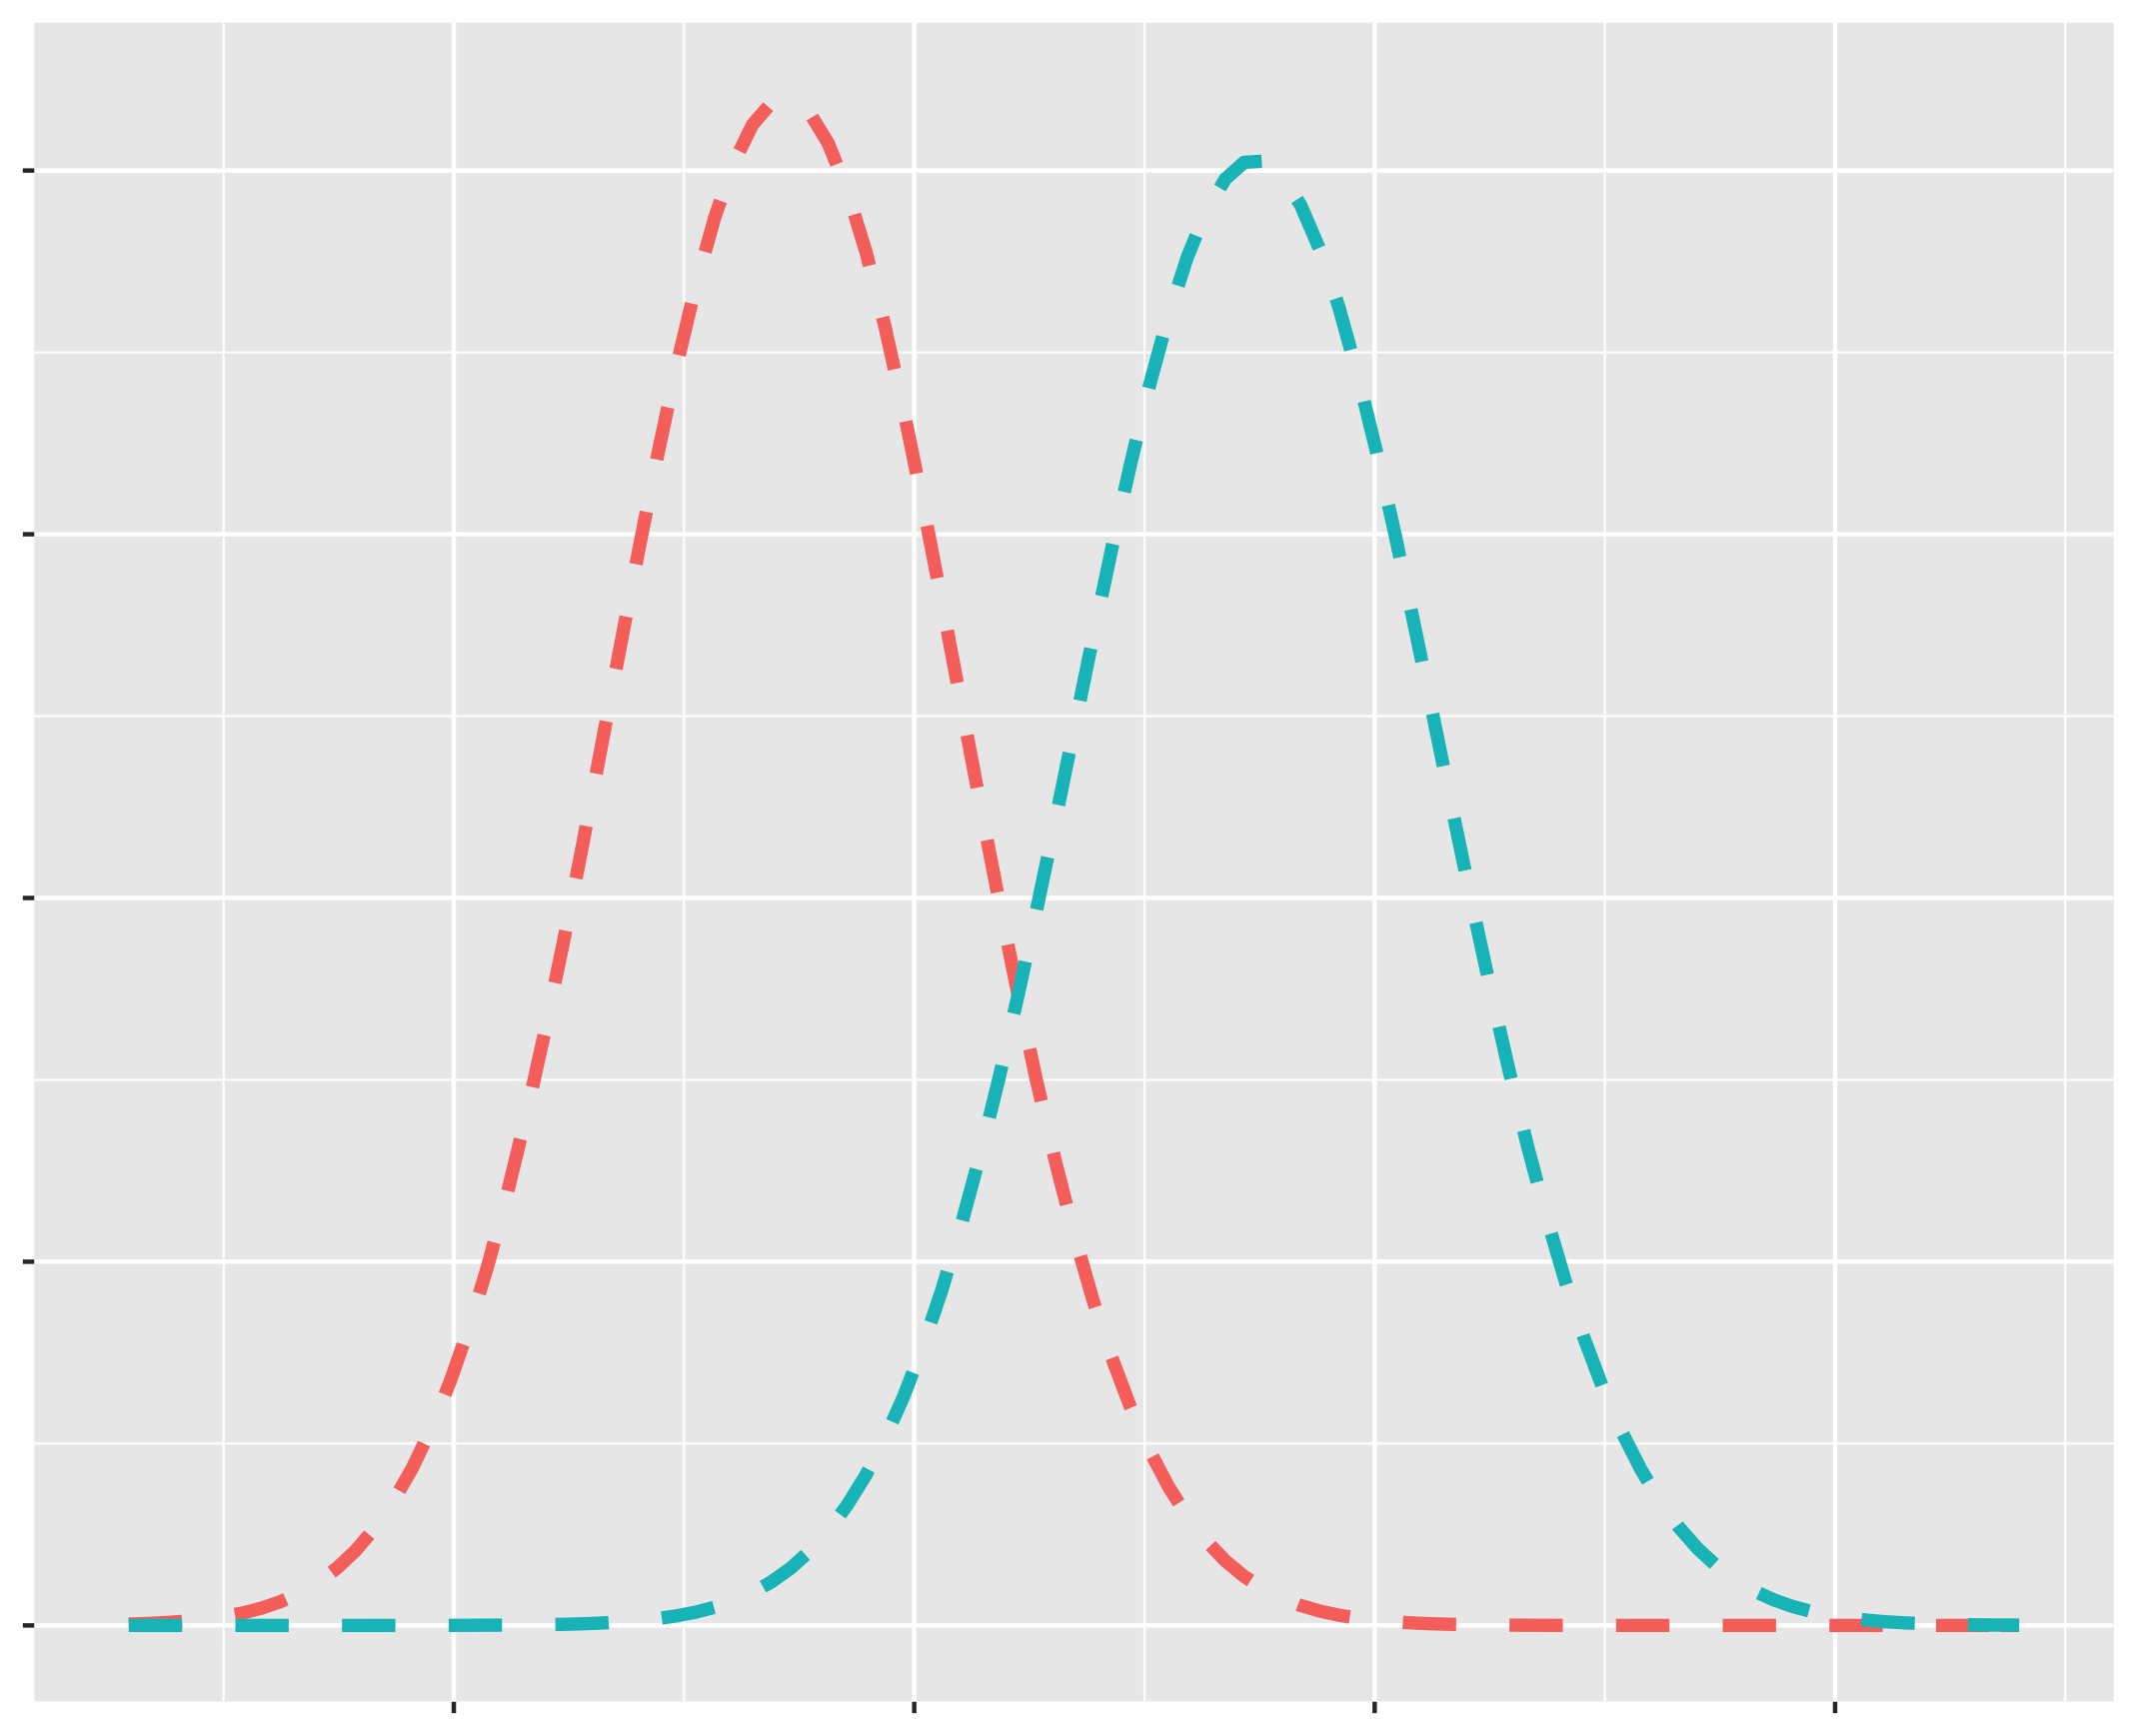
How many clusters?
Which parameters and how to estimate them?