Poisson Mixture Models
Mixture Models in R

Victor Medina
Researches at The University of Edinburgh
# Have a look at the data
glimpse(crimes)
Observations: 77
Variables: 13
$ COMMUNITY             <chr> "ALBANY PARK", "ARCHER HEIGHTS", "...
$ ASSAULT               <int> 123, 51, 74, 169, 708, 1198, 118, ...
$ BATTERY               <int> 429, 134, 184, 448, 1681, 3347, 28...
$ BURGLARY              <int> 147, 92, 55, 194, 339, 517, 76, 14...
$ `CRIMINAL DAMAGE`     <int> 287, 114, 99, 379, 859, 1666, 150,...
$ `CRIMINAL TRESPASS`   <int> 38, 23, 56, 43, 228, 265, 29, 36, ...
$ `DECEPTIVE PRACTICE`  <int> 137, 67, 59, 178, 310, 767, 73, 20...
$ `MOTOR VEHICLE THEFT` <int> 176, 50, 37, 189, 281, 732, 58, 12...
$ NARCOTICS             <int> 27, 18, 9, 30, 345, 1456, 15, 22, ...
$ OTHER                 <int> 107, 37, 48, 114, 584, 1261, 76, 8...
$ `OTHER OFFENSE`       <int> 158, 44, 35, 164, 590, 1130, 94, 1...
$ ROBBERY               <int> 144, 30, 98, 111, 349, 829, 65, 10...
$ THEFT                 <int> 690, 180, 263, 461, 1201, 2137, 23...

Comparison of Poisson with Bernoulli
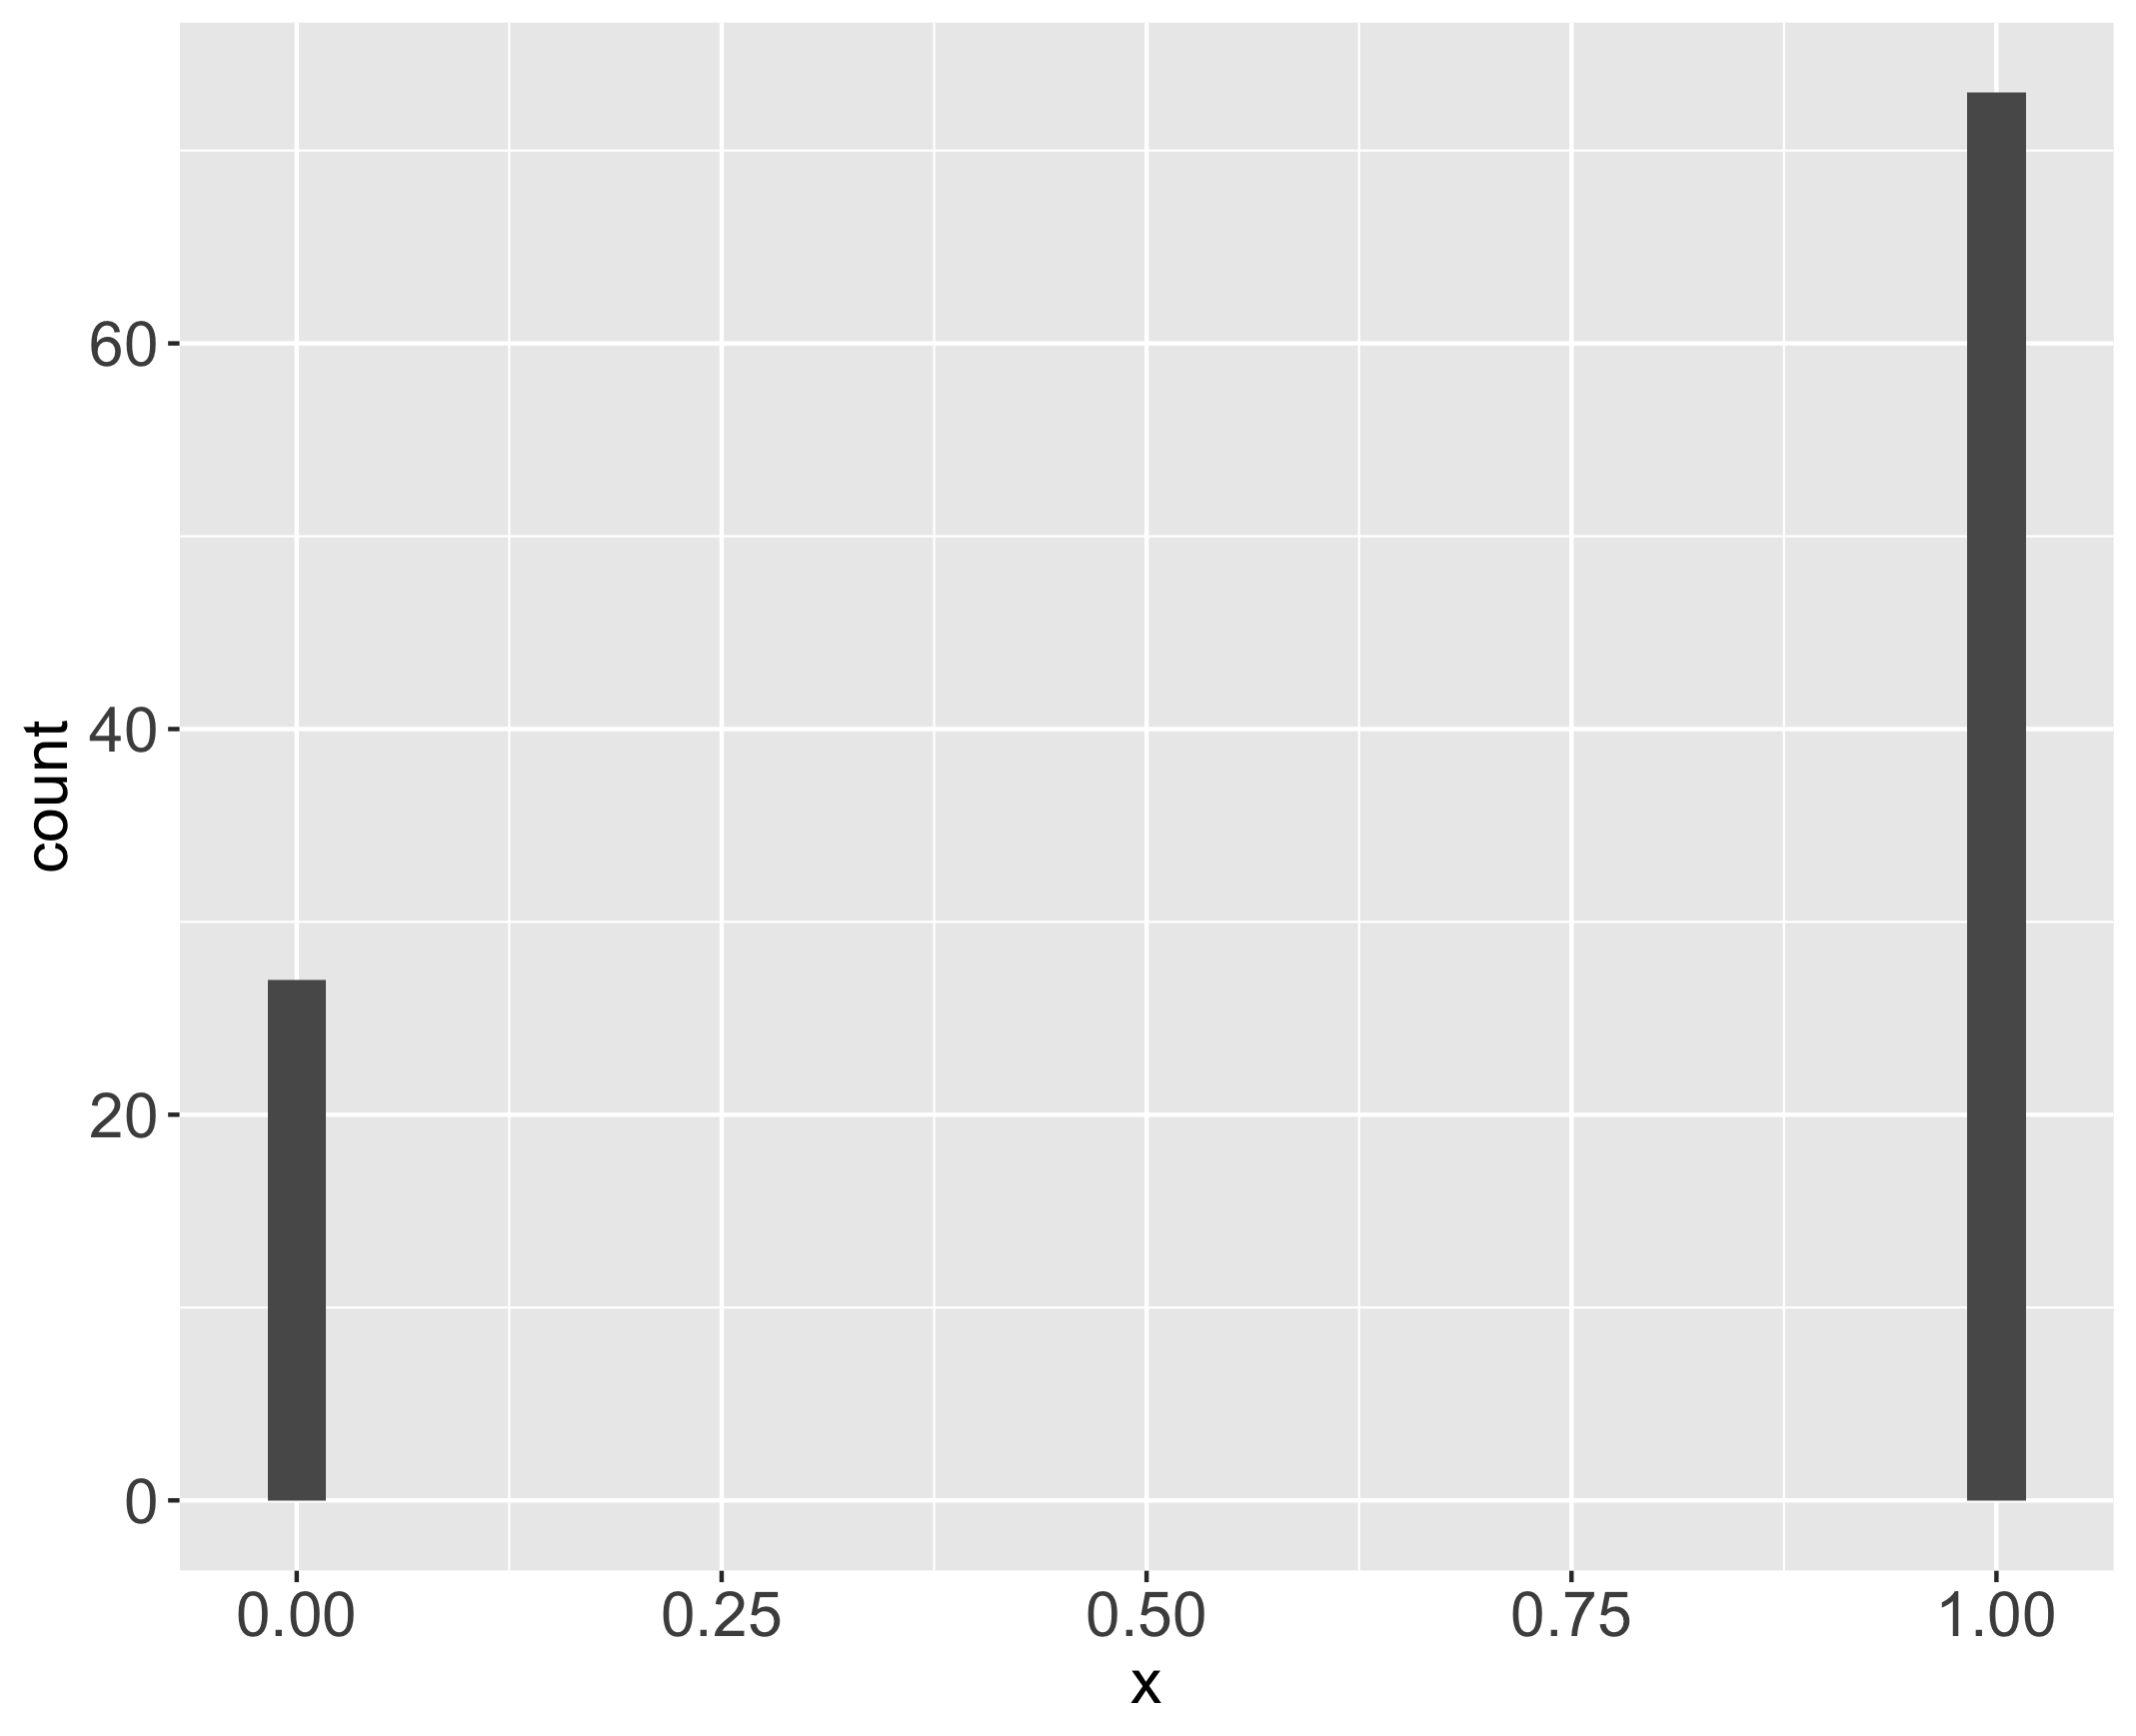
Bernoulli distribution
data.frame(x = bernoulli) %>%
  ggplot(aes(x = x)) + geom_histogram()

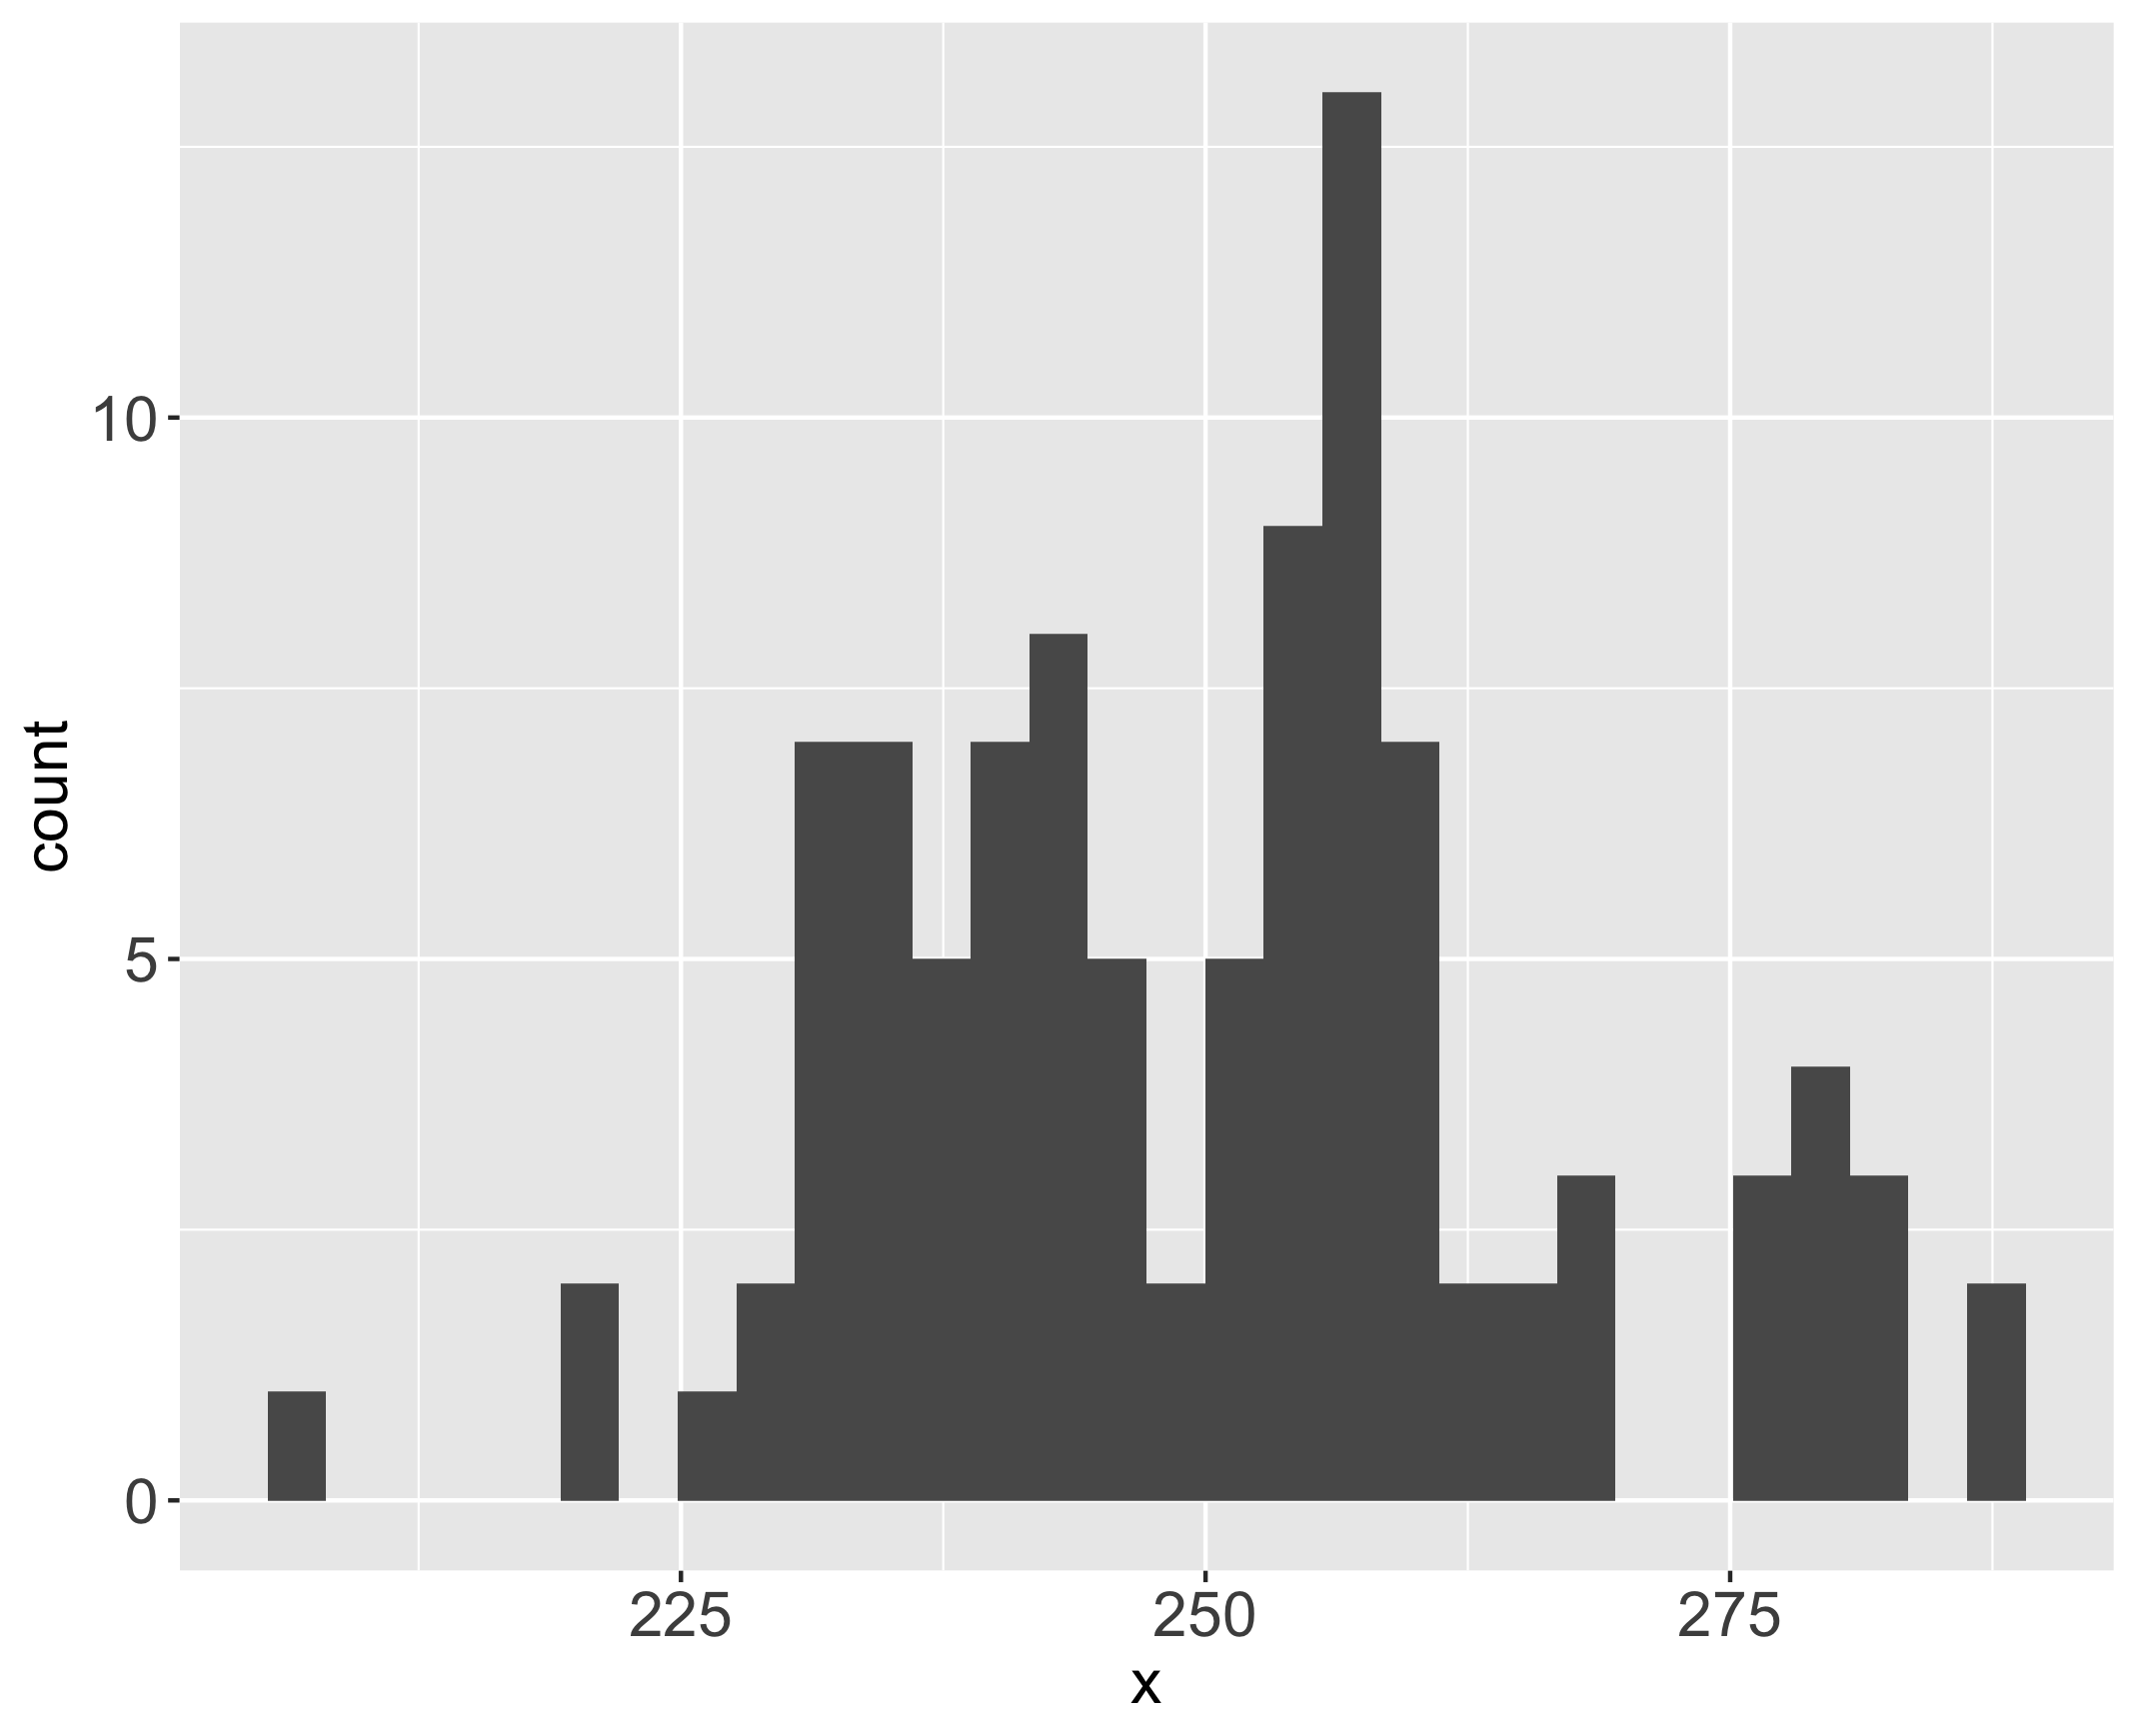
Poisson distribution
data.frame(x = rpois(100,  250)) %>%
  ggplot(aes(x = x)) + geom_histogram()

Poisson distribution
- Number of times an event occurs in an interval of time
- Examples:
- Number of car accidents in a year
- Number of emails received in a day
- Number of robberies in an area of the city for a period of one year
Sample of Poisson distribution
lambda_1 <- 100
poisson_1 <- rpois(n = 100, lambda = lambda_1)
head(poisson_1)
98 98 87 77 102 85
lambda_1 <- 100
lambda_2 <- 200
lambda_3 <- 300

poisson_1 <- rpois(n = 100, lambda = lambda_1)
poisson_2 <- rpois(n = 100, lambda = lambda_2)
poisson_3 <- rpois(n = 100, lambda = lambda_3)

multi_poisson <- cbind(poisson_1, poisson_2, poisson_3)

head(multi_poisson, 4)
     poisson_1 poisson_2 poisson_3
[1,]        98       198       296
[2,]        98       213       312
[3,]        87       197       311
[4,]        77       215       299
head(crimes)
# A tibble: 6 x 13
  COMMUNITY      ASSAULT BATTERY BURGLARY `CRIMINAL DAMAGE` `CRIMINAL TRESPASS`
  <chr>            <int>   <int>    <int>             <int>               <int>
1 ALBANY PARK        123     429      147               287                  38
2 ARCHER HEIGHTS      51     134       92               114                  23
3 ARMOUR SQUARE       74     184       55                99                  56
4 ASHBURN            169     448      194               379                  43
5 AUBURN GRESHAM     708    1681      339               859                 228
6 AUSTIN            1198    3347      517              1666                 265
# ... with 7 more variables: `DECEPTIVE PRACTICE` <int>, `MOTOR VEHICLE THEFT` <int>,
#   NARCOTICS <int>, OTHER <int>, `OTHER OFFENSE` <int>, ROBBERY <int>, THEFT <int>
Poisson mixture model
- Which is the suitable probability distribution?
- (multi) Poisson distribution
- How many subpopulations should we consider?
- Let's try from 1 to 15 clusters and pick by BIC.
- Which are the parameters and their estimations?
- Each lambda for each of the multi Poisson. Also the proportions.
Let's practice!
Mixture Models in R

