EM algorithm
Mixture Models in R

Victor Medina
Researcher at The University of Edinburgh
Same problem, this time for real
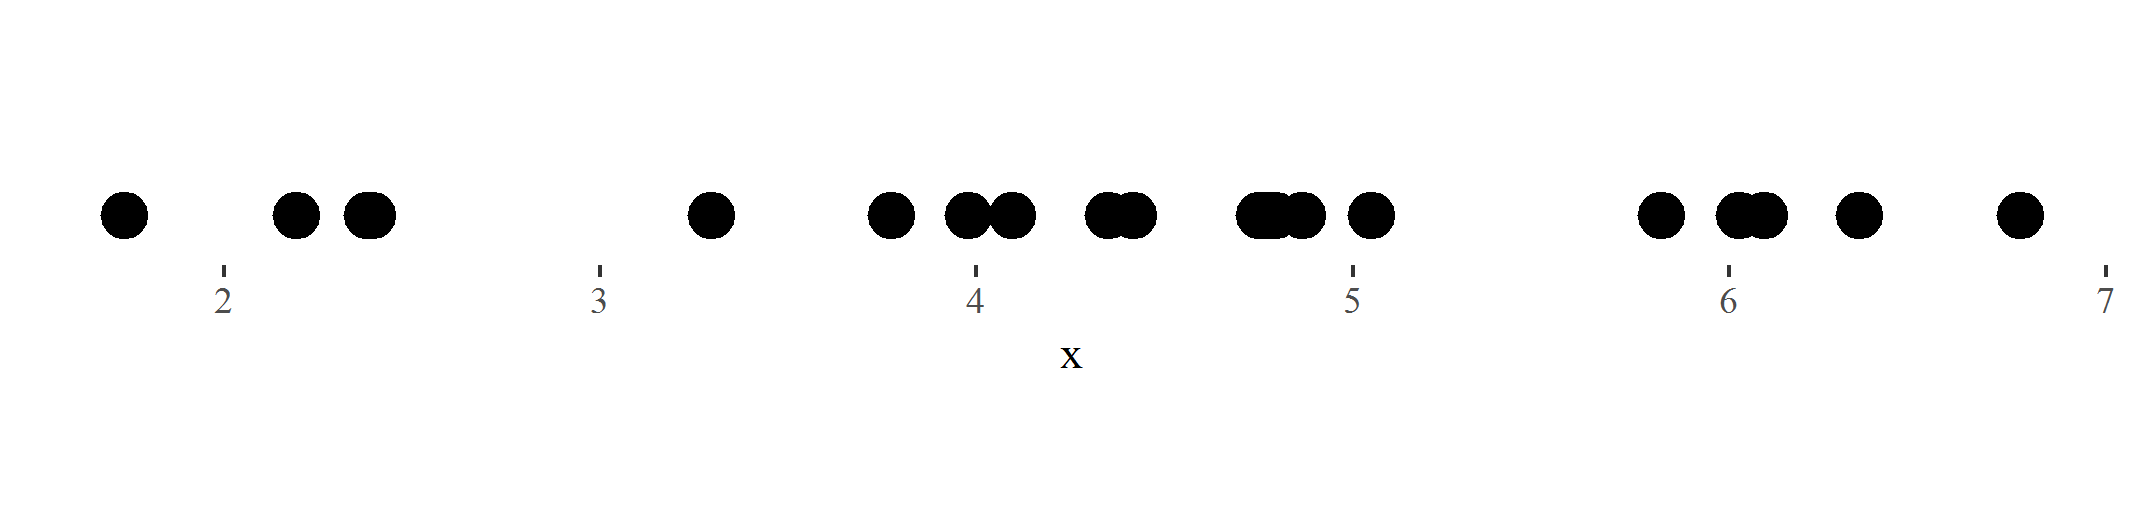
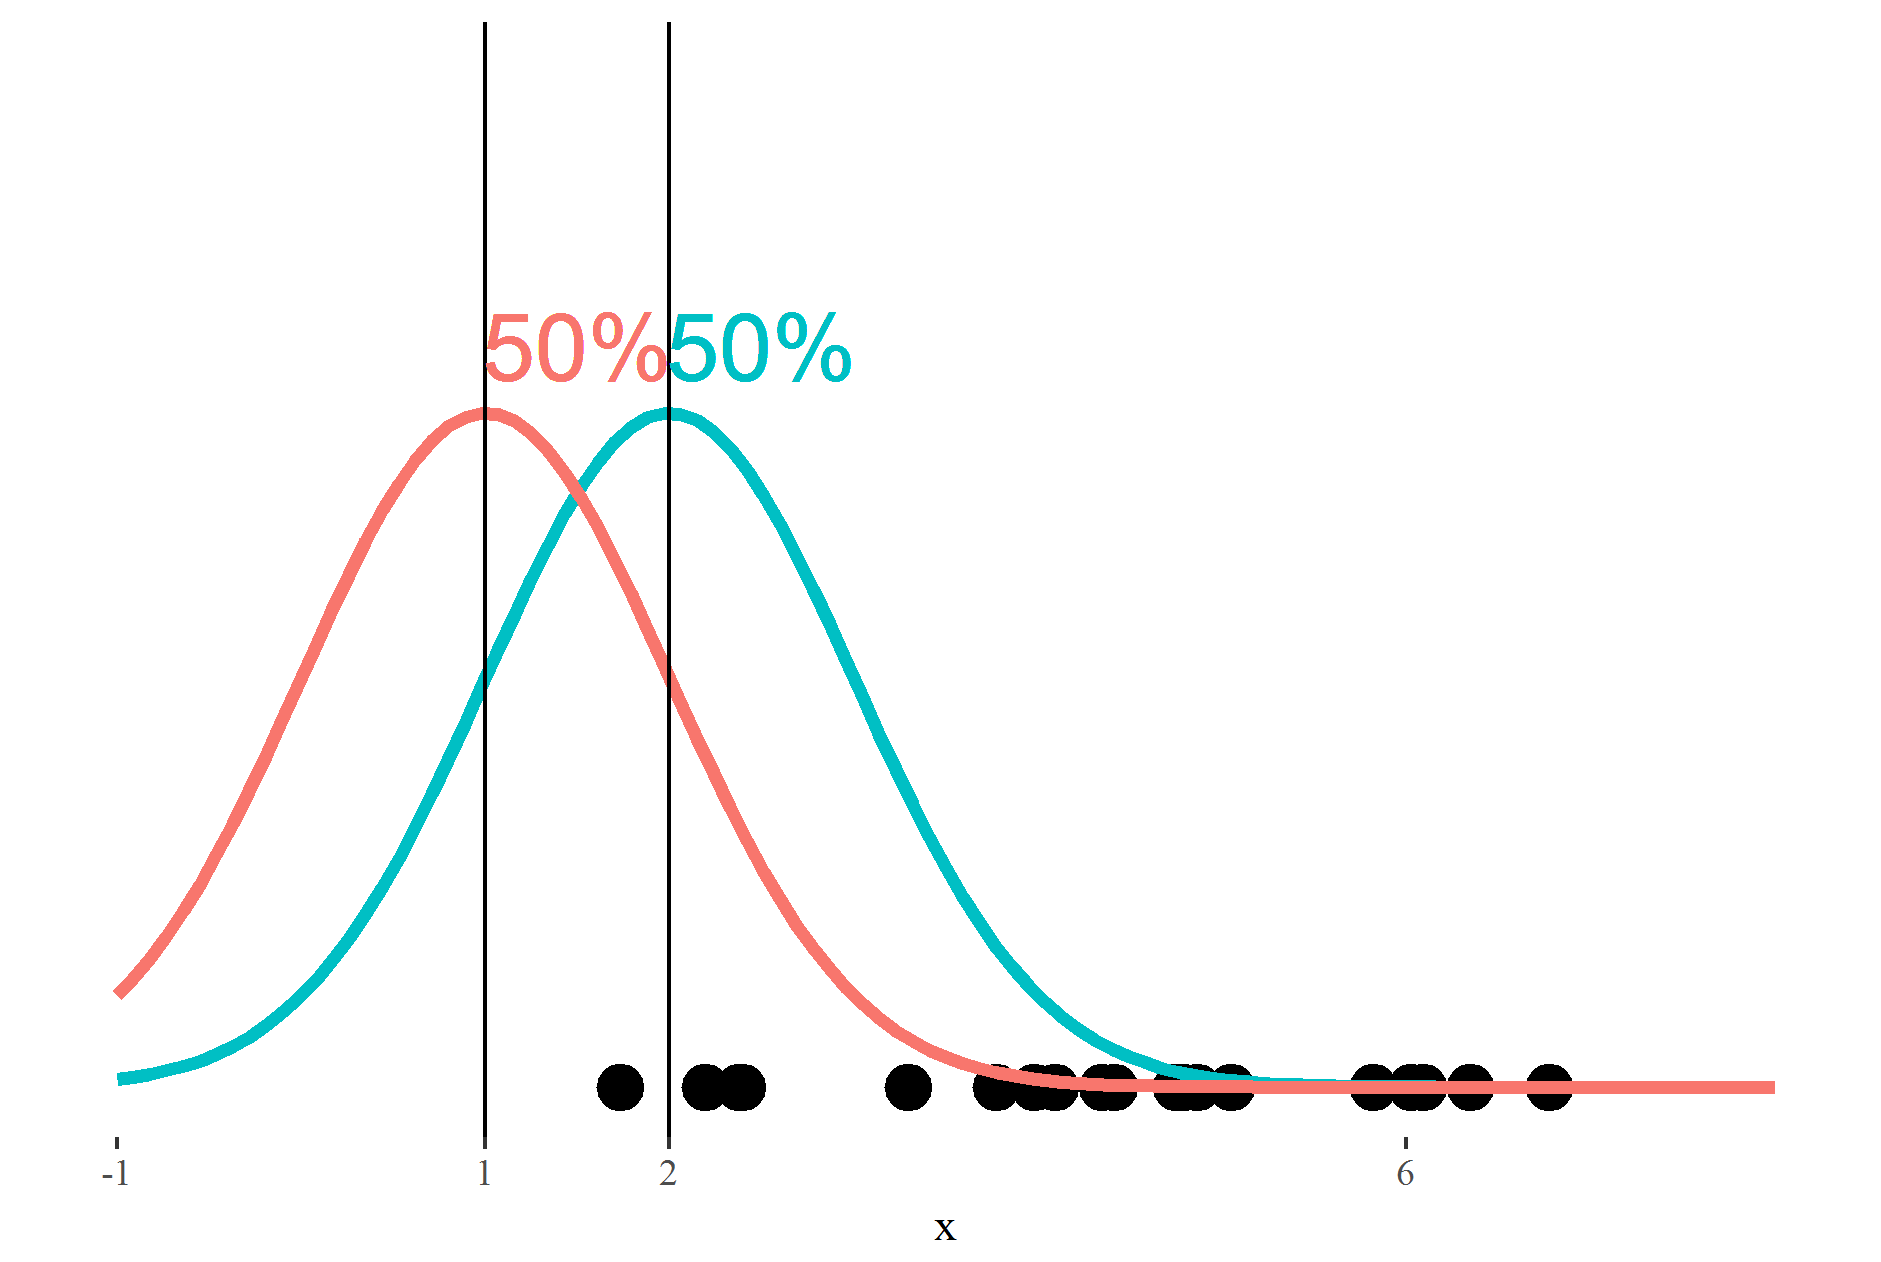
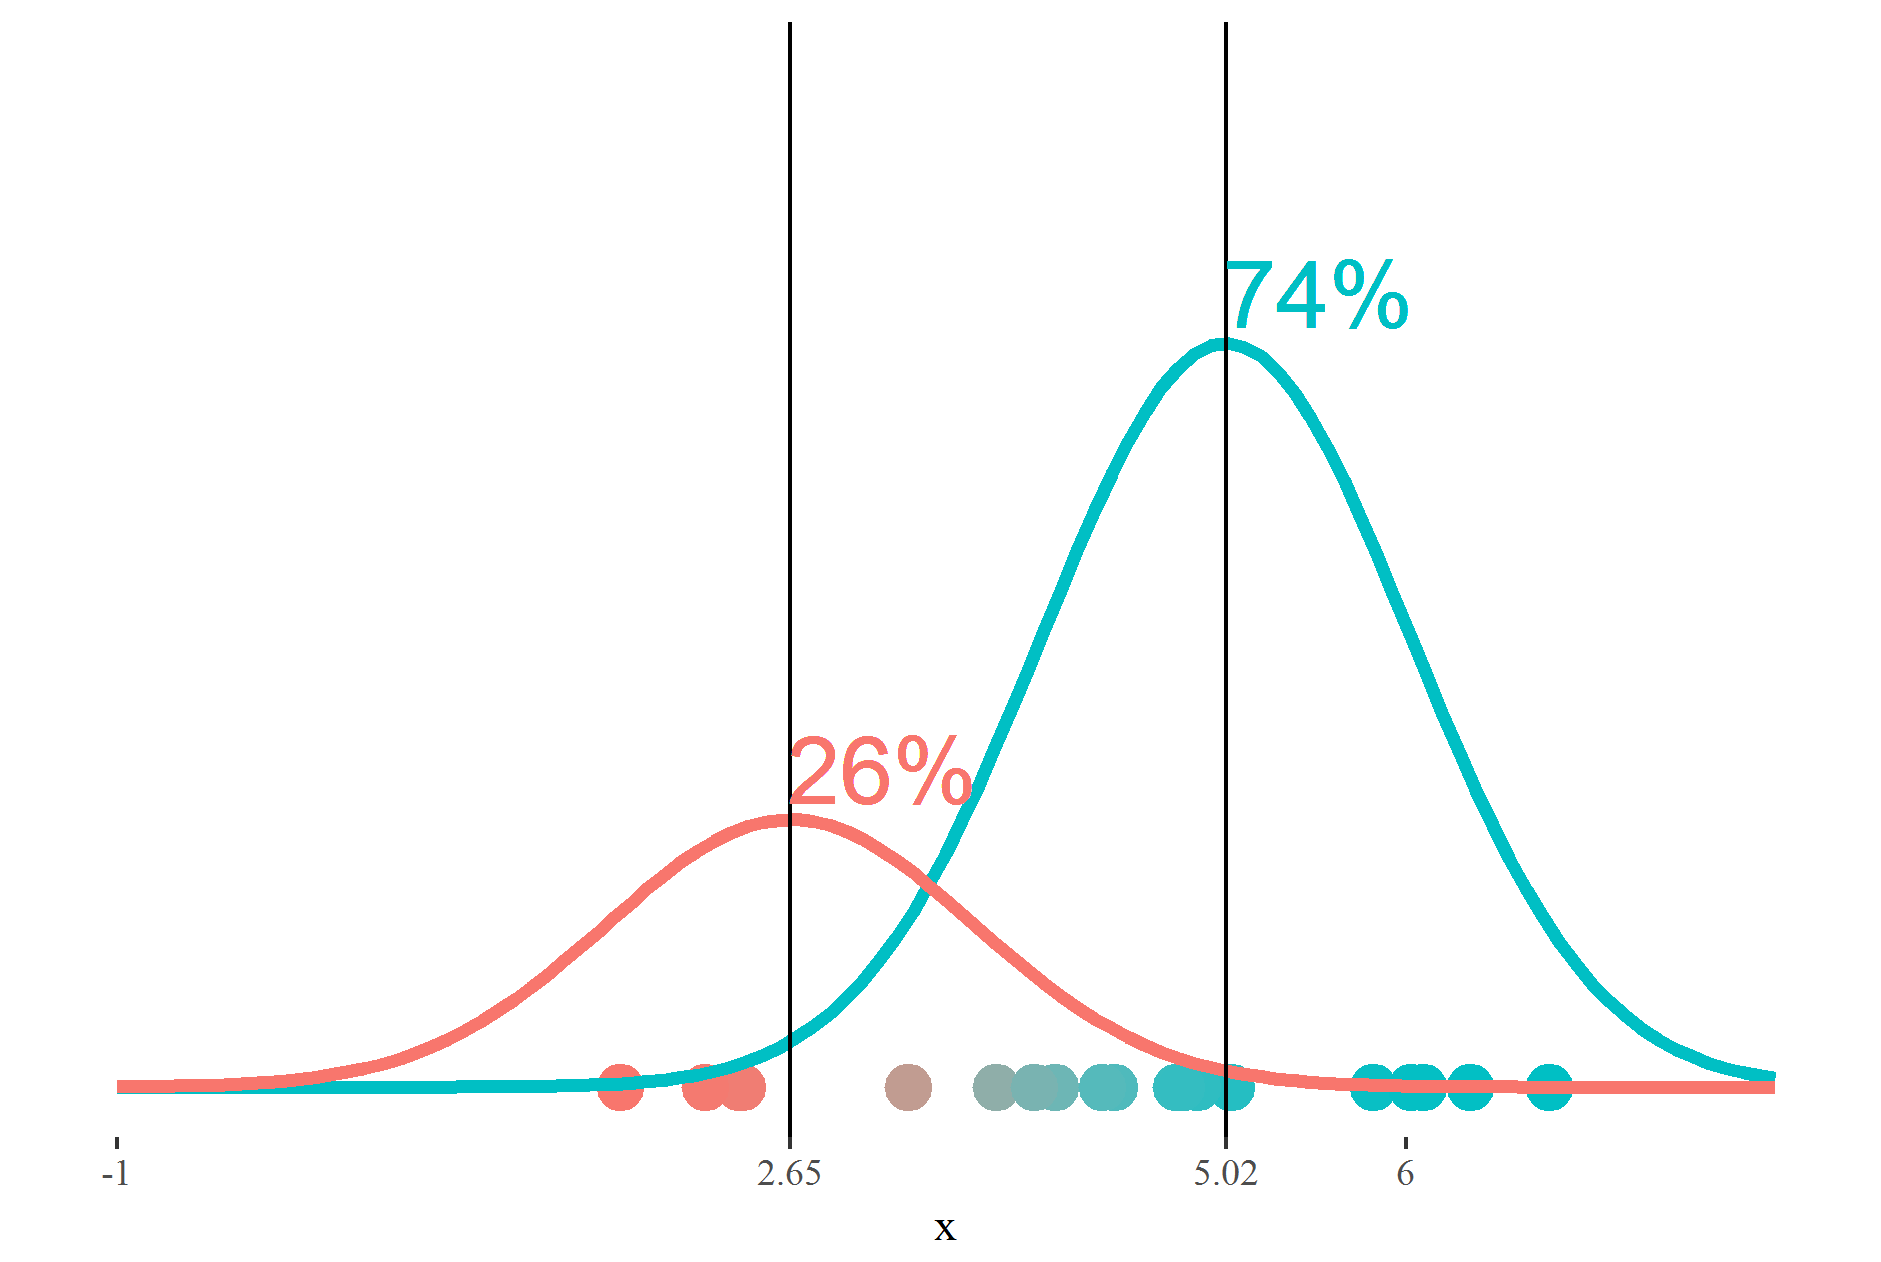
Iteration 0: Initial parameters
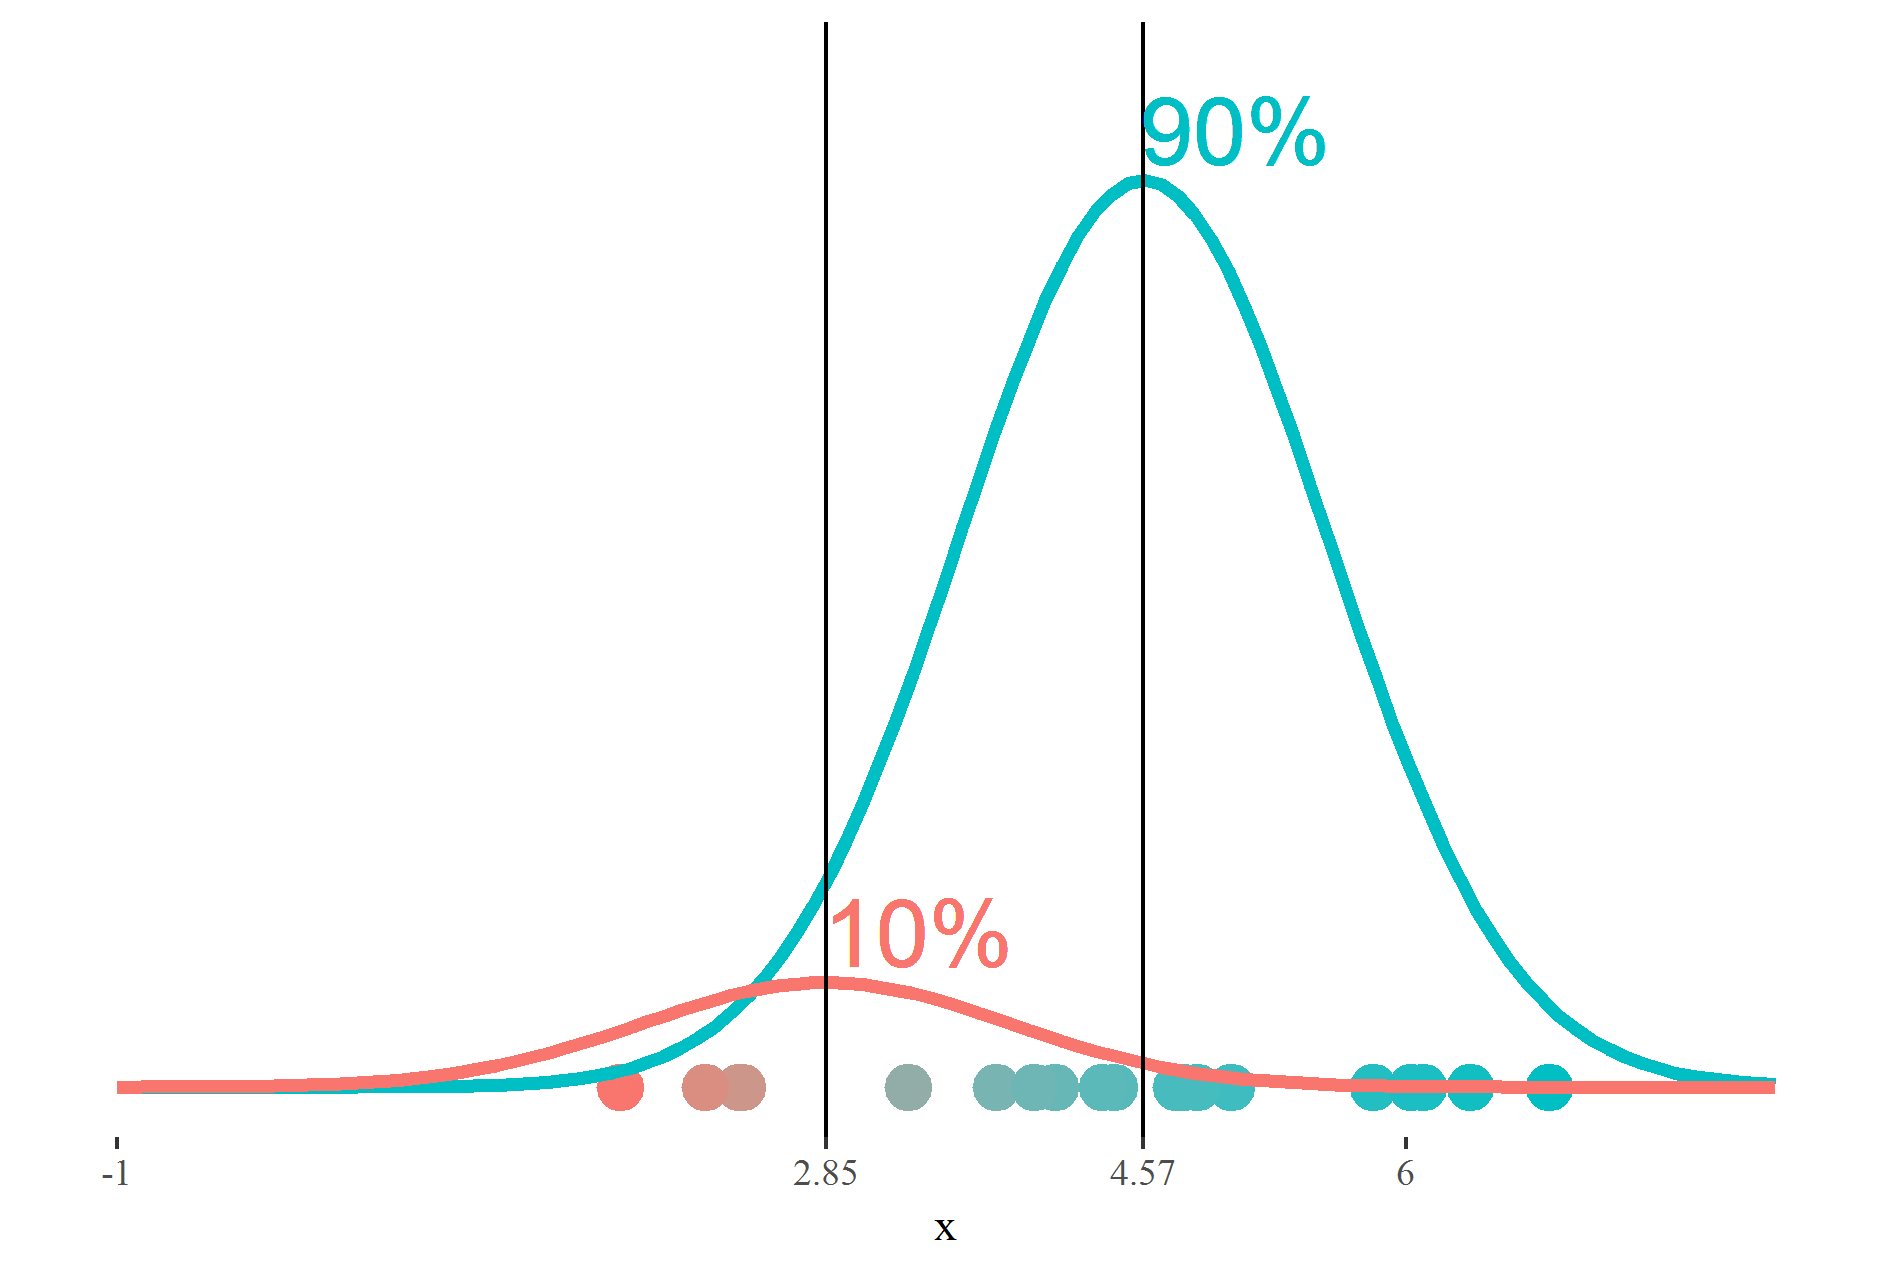
Iteration 1: Estimate parameters (Maximization)
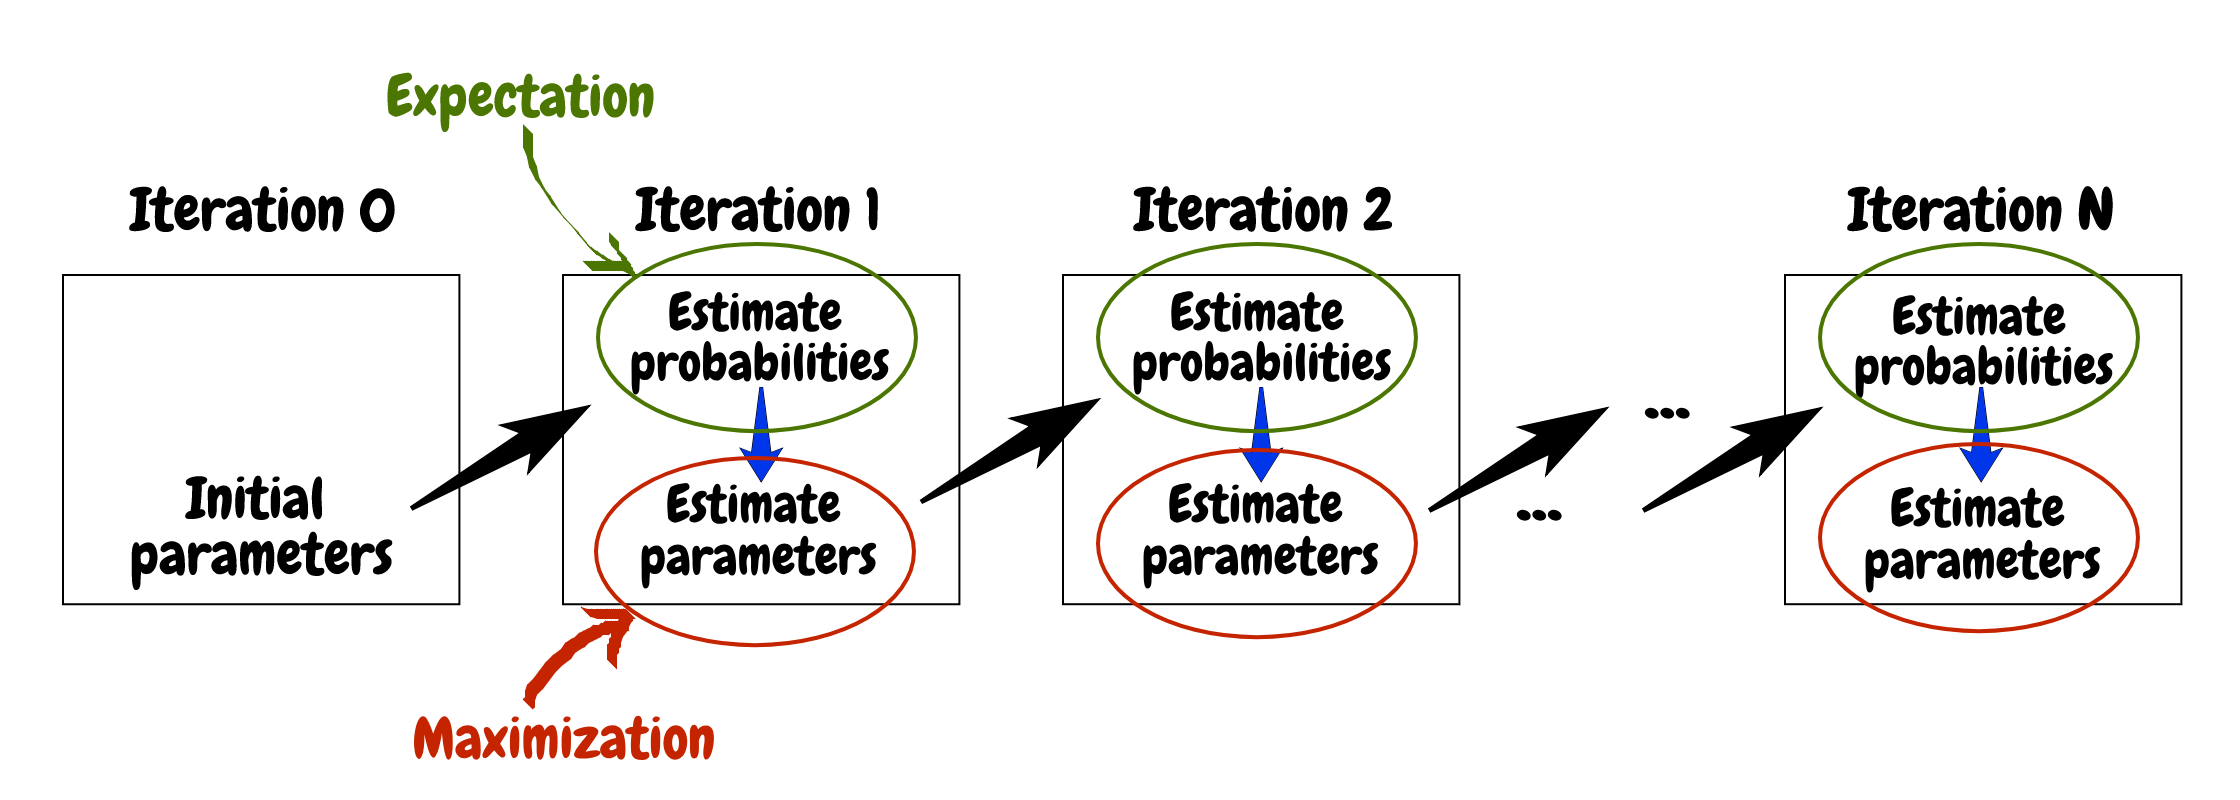
Expectation-Maximization algorithm
Mixture Models in R
Victor Medina
Researcher at The University of Edinburgh

