Support Vector Machines in R
Kailash Awati
Instructor
n <- 600
set.seed(42)

df <- data.frame(x1 = rnorm(n, mean = -0.5, sd = 1),
                 x2 = runif(n, min = -1, max = 1))
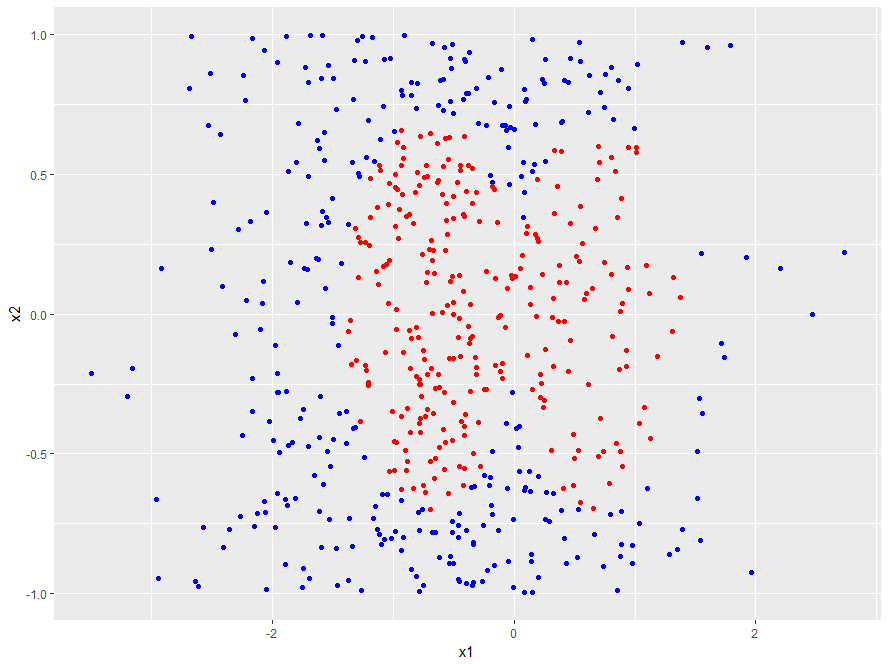
# Set radius and centers
radius <- 0.7
radius_squared <- radius ^ 2
center_1 <- c(-0.7, 0)
center_2 <- c(0.7, 0)

# Classify points
df$y <-
    factor(ifelse(
        (df$x1 - center_1[1]) ^ 2 + (df$x2 - center_1[2]) ^ 2 < radius_squared |
        (df$x1 - center_2[1]) ^ 2 + (df$x2 - center_2[2]) ^ 2 < radius_squared,
        -1, 1), levels = c(-1, 1))
# Set radius and centers radius <- 0.7 radius_squared <- radius ^ 2 center_1 <- c(-0.7, 0) center_2 <- c(0.7, 0)
# Classify points df$y <- factor(ifelse( (df$x1 - center_1[1]) ^ 2 + (df$x2 - center_1[2]) ^ 2 < radius_squared | (df$x1 - center_2[1]) ^ 2 + (df$x2 - center_2[2]) ^ 2 < radius_squared, -1, 1), levels = c(-1, 1))
library(ggplot2)

p <- ggplot(data = df, aes(x = x1, y = x2, color = y)) +
     geom_point() +
     guides(color = "none") +
     scale_color_manual(values = c("red", "blue"))

p
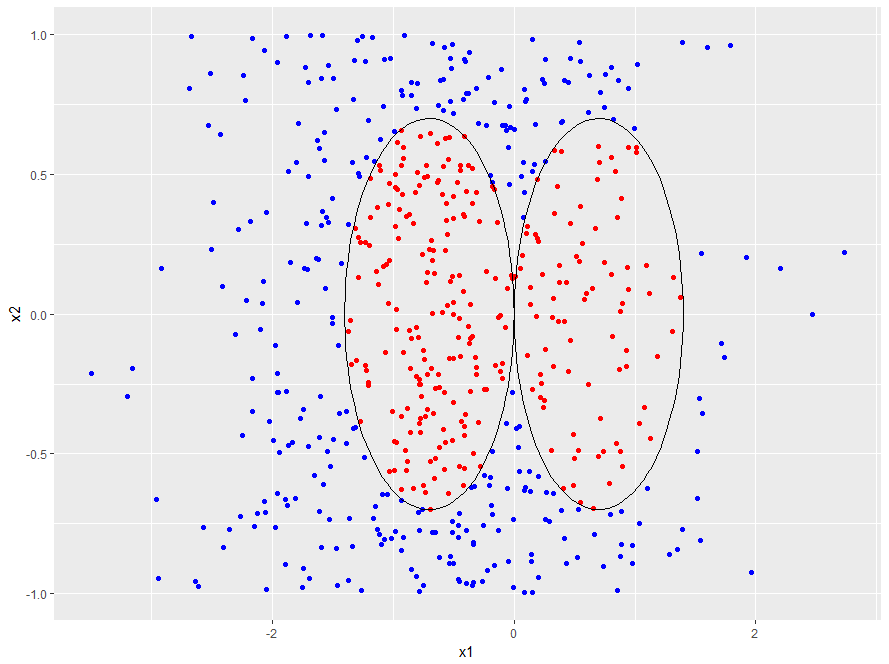
# Function to generate points on a circle
circle <- function(x1_center, x2_center, r, npoint = 100) {
   theta <- seq(0, 2 * pi, length.out = npoint)
   x1_circ <- x1_center + r * cos(theta)
   x2_circ <- x2_center + r * sin(theta)
   data.frame(x1c = x1_circ, x2c = x2_circ)
}

# Generate boundary and plot it
boundary_1 <- circle(x1_center = center_1[1], x2_center = center_1[2], r = radius)
p <- p +
     geom_path(data = boundary_1,
               aes(x = x1c, y = x2c),
               inherit.aes = FALSE)
boundary_2 <- circle(x1_center = center_2[1], x2_center = center_2[2], r = radius)
p <- p +
     geom_path(data = boundary_2,
               aes(x = x1c, y = x2c),
               inherit.aes = FALSE)
p
# Function to generate points on a circle circle <- function(x1_center, x2_center, r, npoint = 100) { theta <- seq(0, 2 * pi, length.out = npoint) x1_circ <- x1_center + r * cos(theta) x2_circ <- x2_center + r * sin(theta) data.frame(x1c = x1_circ, x2c = x2_circ) }
# Generate boundary and plot it boundary_1 <- circle(x1_center = center_1[1], x2_center = center_1[2], r = radius) p <- p + geom_path(data = boundary_1, aes(x = x1c, y = x2c), inherit.aes = FALSE) boundary_2 <- circle(x1_center = center_2[1], x2_center = center_2[2], r = radius) p <- p + geom_path(data = boundary_2, aes(x = x1c, y = x2c), inherit.aes = FALSE) p