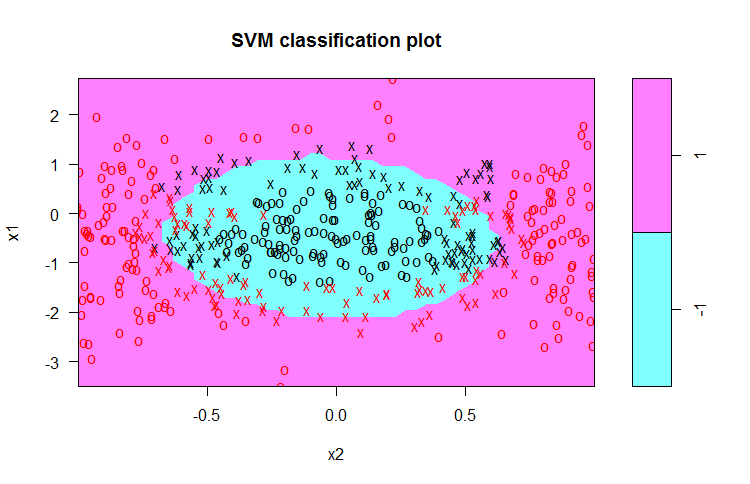
Support Vector Machines in R
Kailash Awati
Instructor
svm_model <- svm(y ~ ., data = trainset,
type = "C-classification",
kernel = "polynomial",
degree = 2)
svm_model
....
Number of Support Vectors: 204
# Predictions
pred_test <- predict(svm_model, testset)
mean(pred_test == testset$y)
0.8666667
plot(svm_model, trainset)
svm_model <- svm(y ~ ., data = trainset,
type = "C-classification",
kernel = "polynomial",
degree = 4)
svm_model
...
Number of Support Vectors: 203
# Predictions
pred_test <- predict(svm_model, testset)
mean(pred_test == testset$y)
0.8583333
plot(svm_model, trainset)
exp(-gamma * r)
, where r
is the distance between X1 and any other point X#rbf function rbf <- function(r, gamma) exp(-gamma * r)
ggplot(data.frame(r = c(-0, 10)), aes(r)) + stat_function(fun = rbf, args = list(gamma = 0.2), aes(color = "0.2")) + stat_function(fun = rbf, args = list(gamma = 0.4), aes(color = "0.4")) + stat_function(fun = rbf, args = list(gamma = 0.6), aes(color = "0.6")) + stat_function(fun = rbf, args = list(gamma = 0.8), aes(color = "0.8")) + stat_function(fun = rbf, args = list(gamma = 1), aes(color = "1")) + stat_function(fun = rbf, args = list(gamma = 2), aes(color = "2")) + scale_color_manual("gamma", values = c("red","orange","yellow", "green","blue","violet")) + ggtitle("Radial basis function (gamma = 0.2 to 2)")
Support Vector Machines in R