Generating a linearly separable dataset
Support Vector Machines in R

Kailash Awati
Instructor
Overview of lesson
- Create a dataset that we'll use to illustrate key principles of SVMs.
- Dataset has two variables and a linear decision boundary.
Generating a two-dimensional dataset using runif()
- Generate a two variable dataset with 200 points
- Variables
x1andx2uniformly distributed in (0,1).
# Preliminaries... # Set required number of data points n <- 200 # Set seed to ensure reproducibility set.seed(42)# Generate dataframe with two predictors x1 and x2 in (0,1) df <- data.frame(x1 = runif(n), x2 = runif(n))
Creating two classes
- Create two classes, separated by the straight line decision boundary
x1 = x2 - Line passes through (0, 0) and makes a 45 degree angle with horizontal
- Class variable
y = -1for points below line andy = 1for points above it
# Classify points as -1 or +1
df$y <- factor(ifelse(df$x1 - df$x2 > 0, -1, 1),
               levels = c(-1, 1))
Visualizing dataset using ggplot
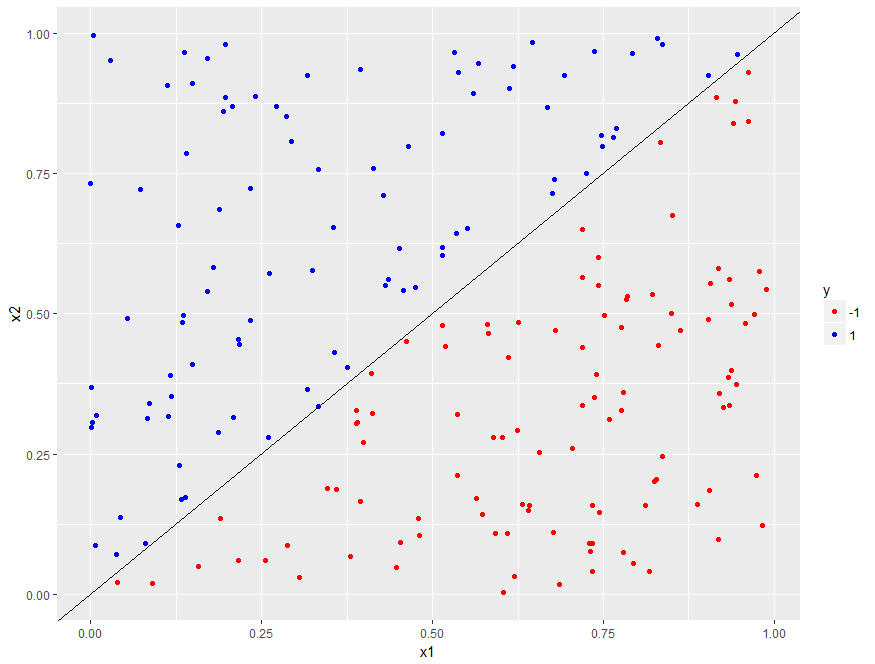
- Create 2 dimensional scatter plot with x1 on the x axis and x2 on the y-axis
- Distinguish classes by color (below line = red; above line = blue)
- Decision boundary is line
x1 = x2: passes through (0, 0) and has slope = 1
library(ggplot2)

# Build plot
p <- ggplot(data = df, aes(x = x1, y = x2, color = y)) +
     geom_point() +
     scale_color_manual(values = c("-1" = "red", "1" = "blue")) +
     geom_abline(slope = 1, intercept = 0)

# Display it
p

Introducing a margin
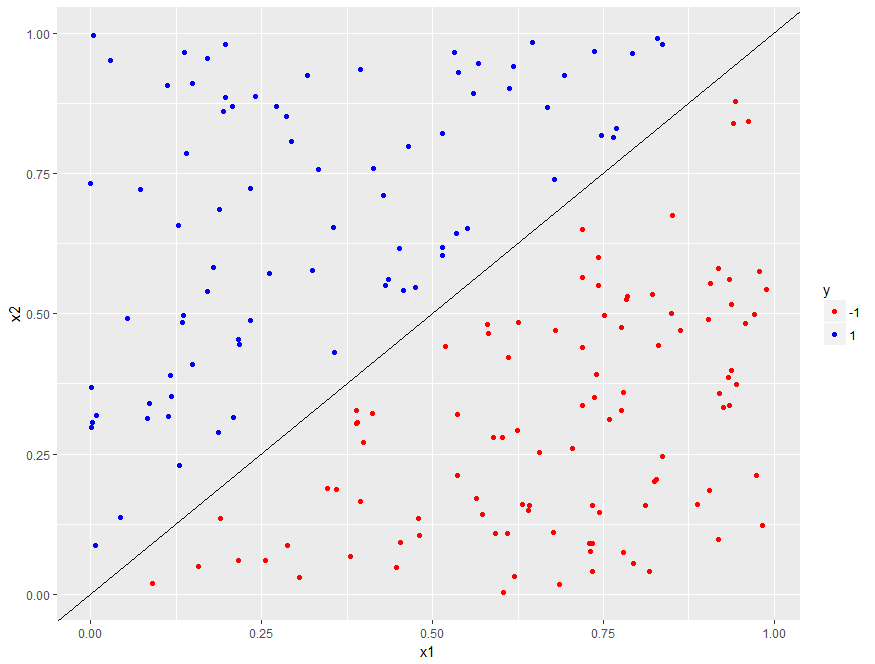
- To create a margin we need to remove points that lie close to the boundary
- Remove points that have x1 and x2 values that differ by less than a specified value
# Create a margin of 0.05 in dataset delta <- 0.05 # Retain only those points that lie outside the margin df1 <- df[abs(df$x1 - df$x2) > delta, ] # Check number of data points remaining nrow(df1)# Replot dataset with margin (code is exactly same as before) p <- ggplot(data = df1, aes(x = x1, y = x2, color = y)) + geom_point() + scale_color_manual(values = c("red", "blue")) + geom_abline(slope = 1, intercept = 0) # Display plot p

Plotting the margin boundaries
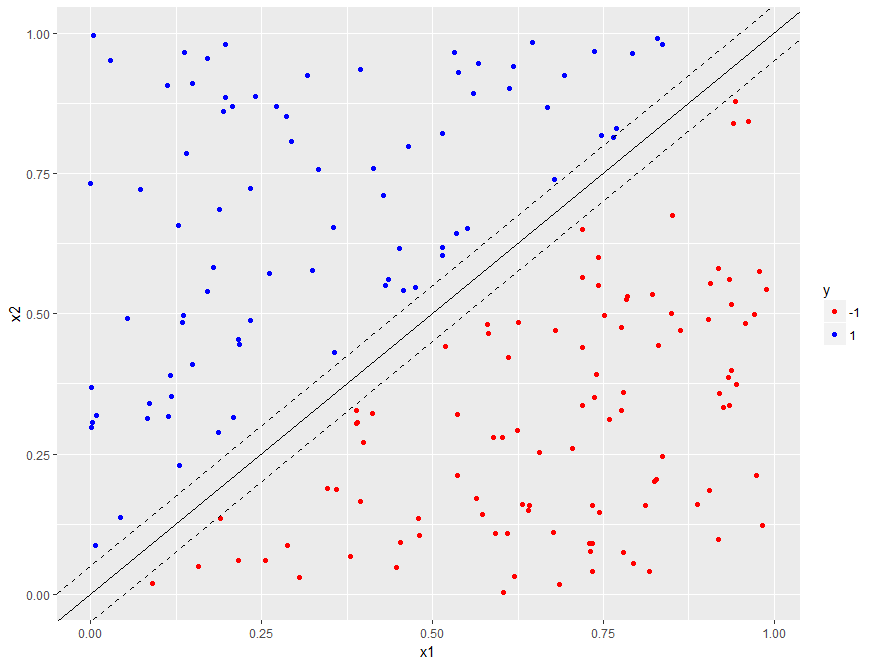
- The margin boundaries are:
- parallel to the decision boundary (slope = 1).
- located delta units on either side of it (delta = 0.05).
p <- p +
     geom_abline(slope = 1, intercept = delta, linetype = "dashed") +
     geom_abline(slope = 1, intercept = -delta, linetype = "dashed")

p

Time to practice!
Support Vector Machines in R

