library(ggplot2)
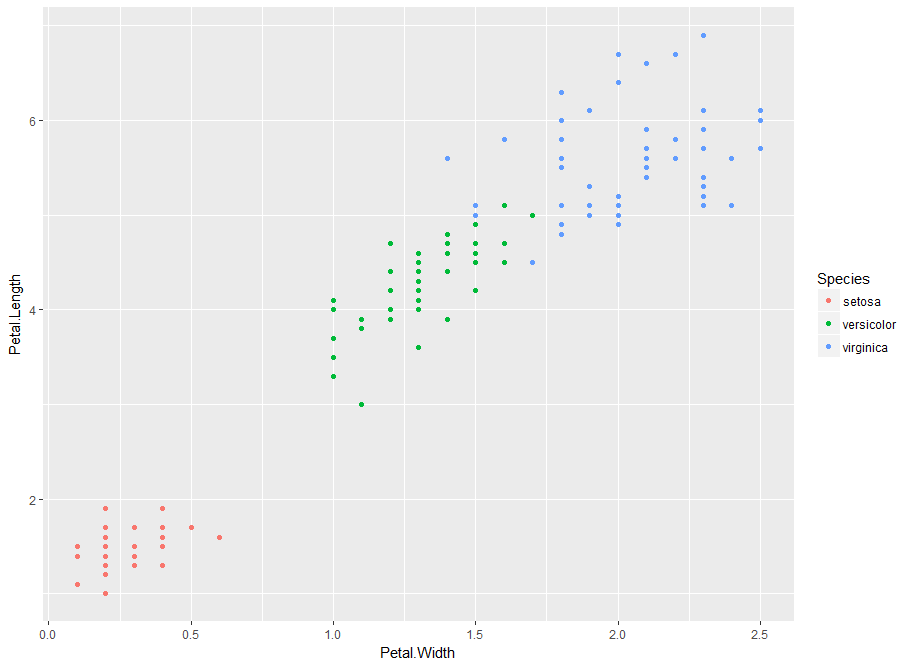
# Plot petal length vs width for dataset, distinguish species by color
p <- ggplot(data = iris,
aes(x = Petal.Width,
y = Petal.Length,
color = Species)) +
geom_point()
# Display plot
p
How does the SVM algorithm deal with multiclass problems?
SVMs are essentially binary classifiers.
Can be applied to multiclass problems using the following voting strategy:
Partition the data into subsets containing two classes each.
Solve the binary classification problem for each subset.
Use majority vote to assign a class to each data point.
Called one-against-one classification strategy.
Building a multiclass linear SVM
Build a linear SVM for the iris dataset
80/20 training / test split (seed 10), default cost
library(e1071)

# Build model
svm_model <- svm(Species ~ .,
                data = trainset,
                type = "C-classification",
                kernel = "linear")