Plotting Polygons
Interactive Maps with leaflet in R

Rich Majerus
Vice President of Strategy & Planning, Queens University of Charlotte
Spatial Data
Storing point data in data frame
name       lng      lat state sector_label
Colby College -69.66337 44.56421    ME      Private
Storing polygon data in data frame
        lng      lat   zip    area mean_income
1 -76.39781 35.79743 27925 0.06686    35733.33
2 -76.35355 35.86130 27925 0.06686    35733.33
3 -76.34927 35.89326 27925 0.06686    35733.33
4 -76.31882 35.90419 27925 0.06686    35733.33
5 -76.33822 35.90419 27925 0.06686    35733.33
...
SpatialPolygonsDataFrame

SpatialPolygonsDataFrame

Working with Spatial Data in R
glimpse(shp@data)
Observations: 808
Variables: 2
$ GEOID10 <dbl> 27925, 28754, 28092, 27217, 28711...
$ ALAND10 <fct> 624688620, 223734670, 317180853, 318965510, 258603117...
shp@data <- shp@data %>%
  left_join(nc_income, by = c("GEOID10" = "zipcode"))
Working with Spatial Data in R
glimpse(shp@data)
Observations: 808
Variables: 5
$ GEOID10     <dbl> 27925, 28754, 28092, 27217, 28711,...
$ ALAND10     <fctr> 624688620, 223734670, 317180853, ...
$ returns     <int> 1590, 3230, 15760, 15830, 6070, NA...
$ income      <dbl> 56816000, 147845000, 708297000, 57...
$ mean_income <dbl> 35733.33, 45772.45, 44942.70, 3648...
Our SpatialPolygonsDataFrame
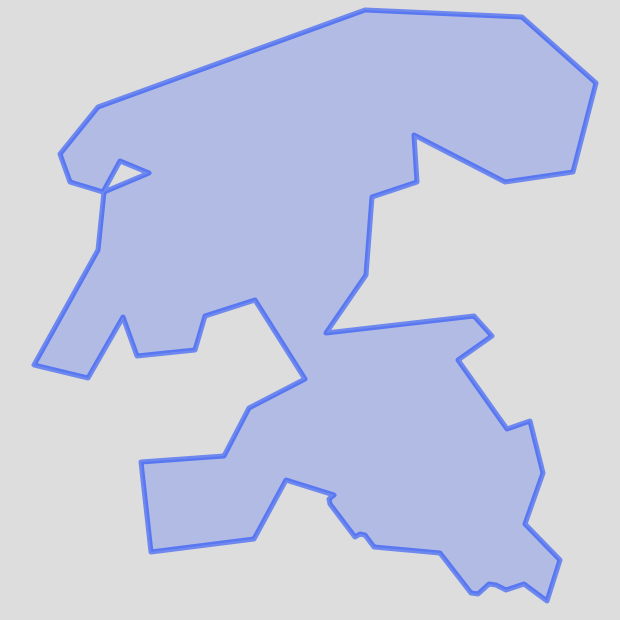
# plotting polygon 1
shp@polygons[[1]] %>%
            leaflet() %>%
            addPolygons()

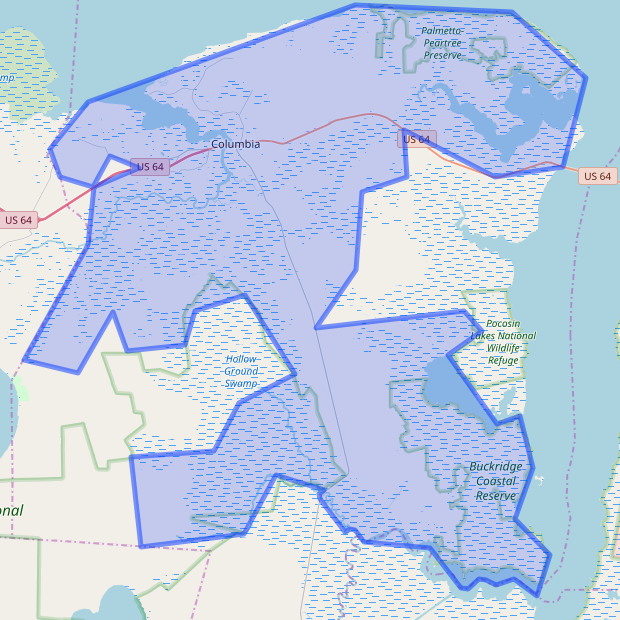
shp@polygons[[1]] %>%
           leaflet() %>%
           addTiles() %>%
           addPolygons()

Let's practice!
Interactive Maps with leaflet in R

