Overlay Groups
Interactive Maps with leaflet in R

Rich Majerus
Vice President of Strategy & Planning, Queens University of Charlotte
Grouping Colleges by Sector
m <- ca_colleges %>%
  leaflet() %>%
  addProviderTiles("CartoDB")
m %>%
  addCircleMarkers(
              radius = 2,
              label = ~name)

ca_public <- ipeds  %>%
  filter(sector == "Public",
         state == "CA")
m %>%
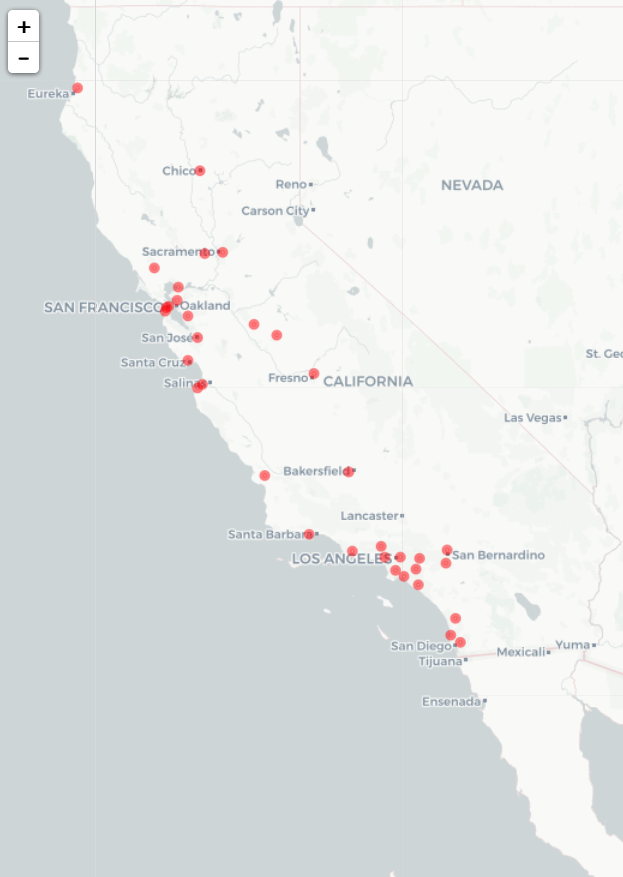
  addCircleMarkers(
        data = ca_public,
        group = "Public")

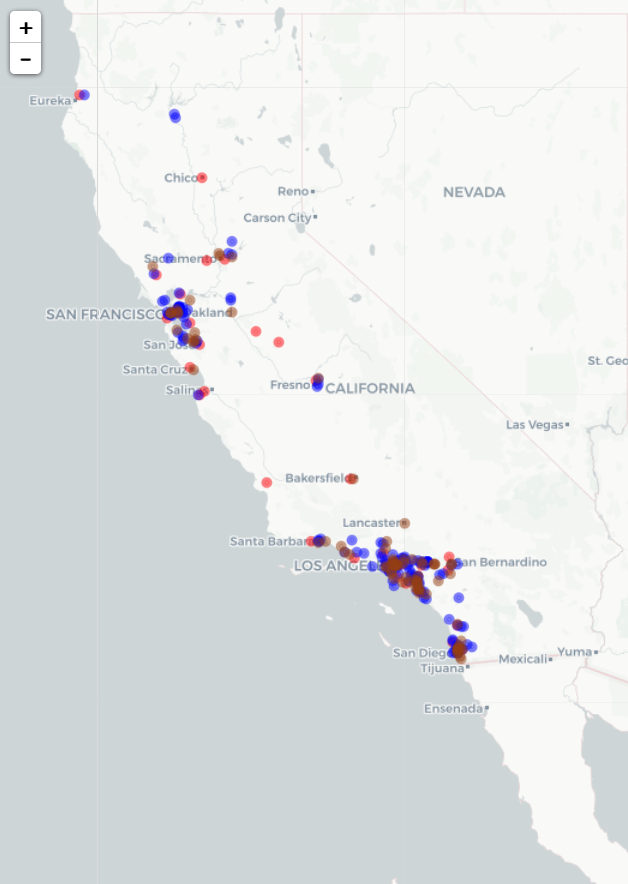
m %>% addCircleMarkers( data = ca_public, color = ~pal(sector_label), group = "Public") %>%addCircleMarkers( data = ca_private, color = ~pal(sector_label), group = "Private") %>%addCircleMarkers( data = ca_profit, color = ~pal(sector_label), group = "For-Profit")

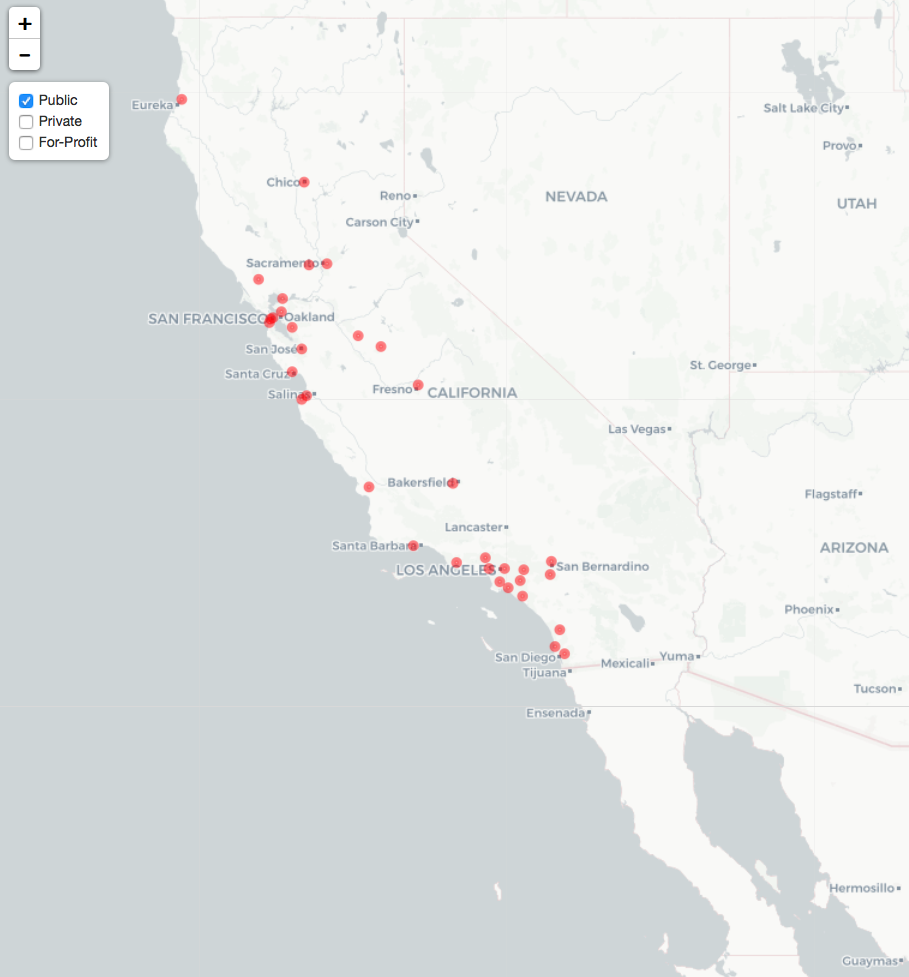
m %>% addCircleMarkers( data = ca_public, color = ~pal(sector_label), group = "Public") %>%addCircleMarkers( data = ca_private, color = ~pal(sector_label), group = "Private") %>%addCircleMarkers( data = ca_profit, color = ~pal(sector_label), group = "For-Profit") %>%addLayersControl( overlayGroups = c("Public", "Private", "For-Profit"))

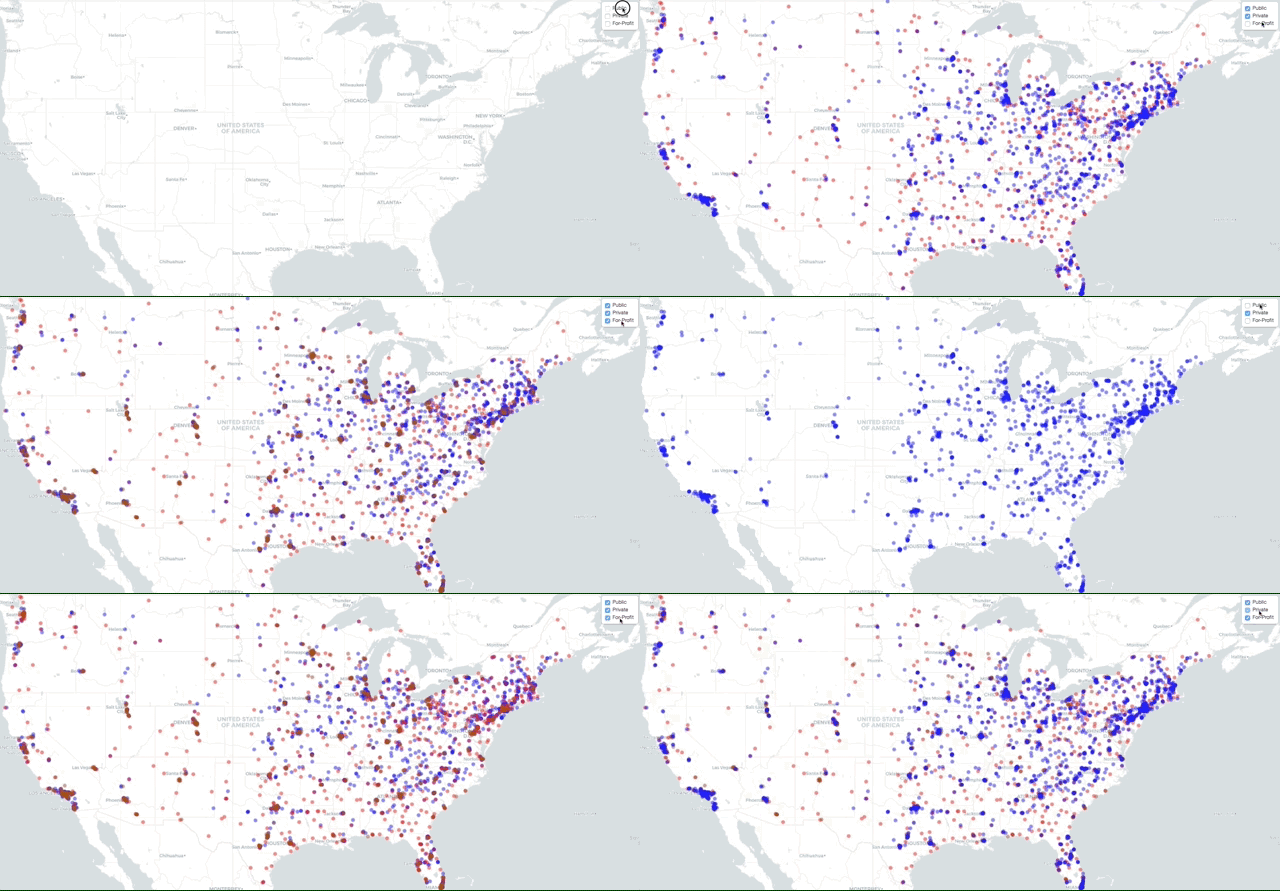
What We are Working Toward

Let's practice!
Interactive Maps with leaflet in R

