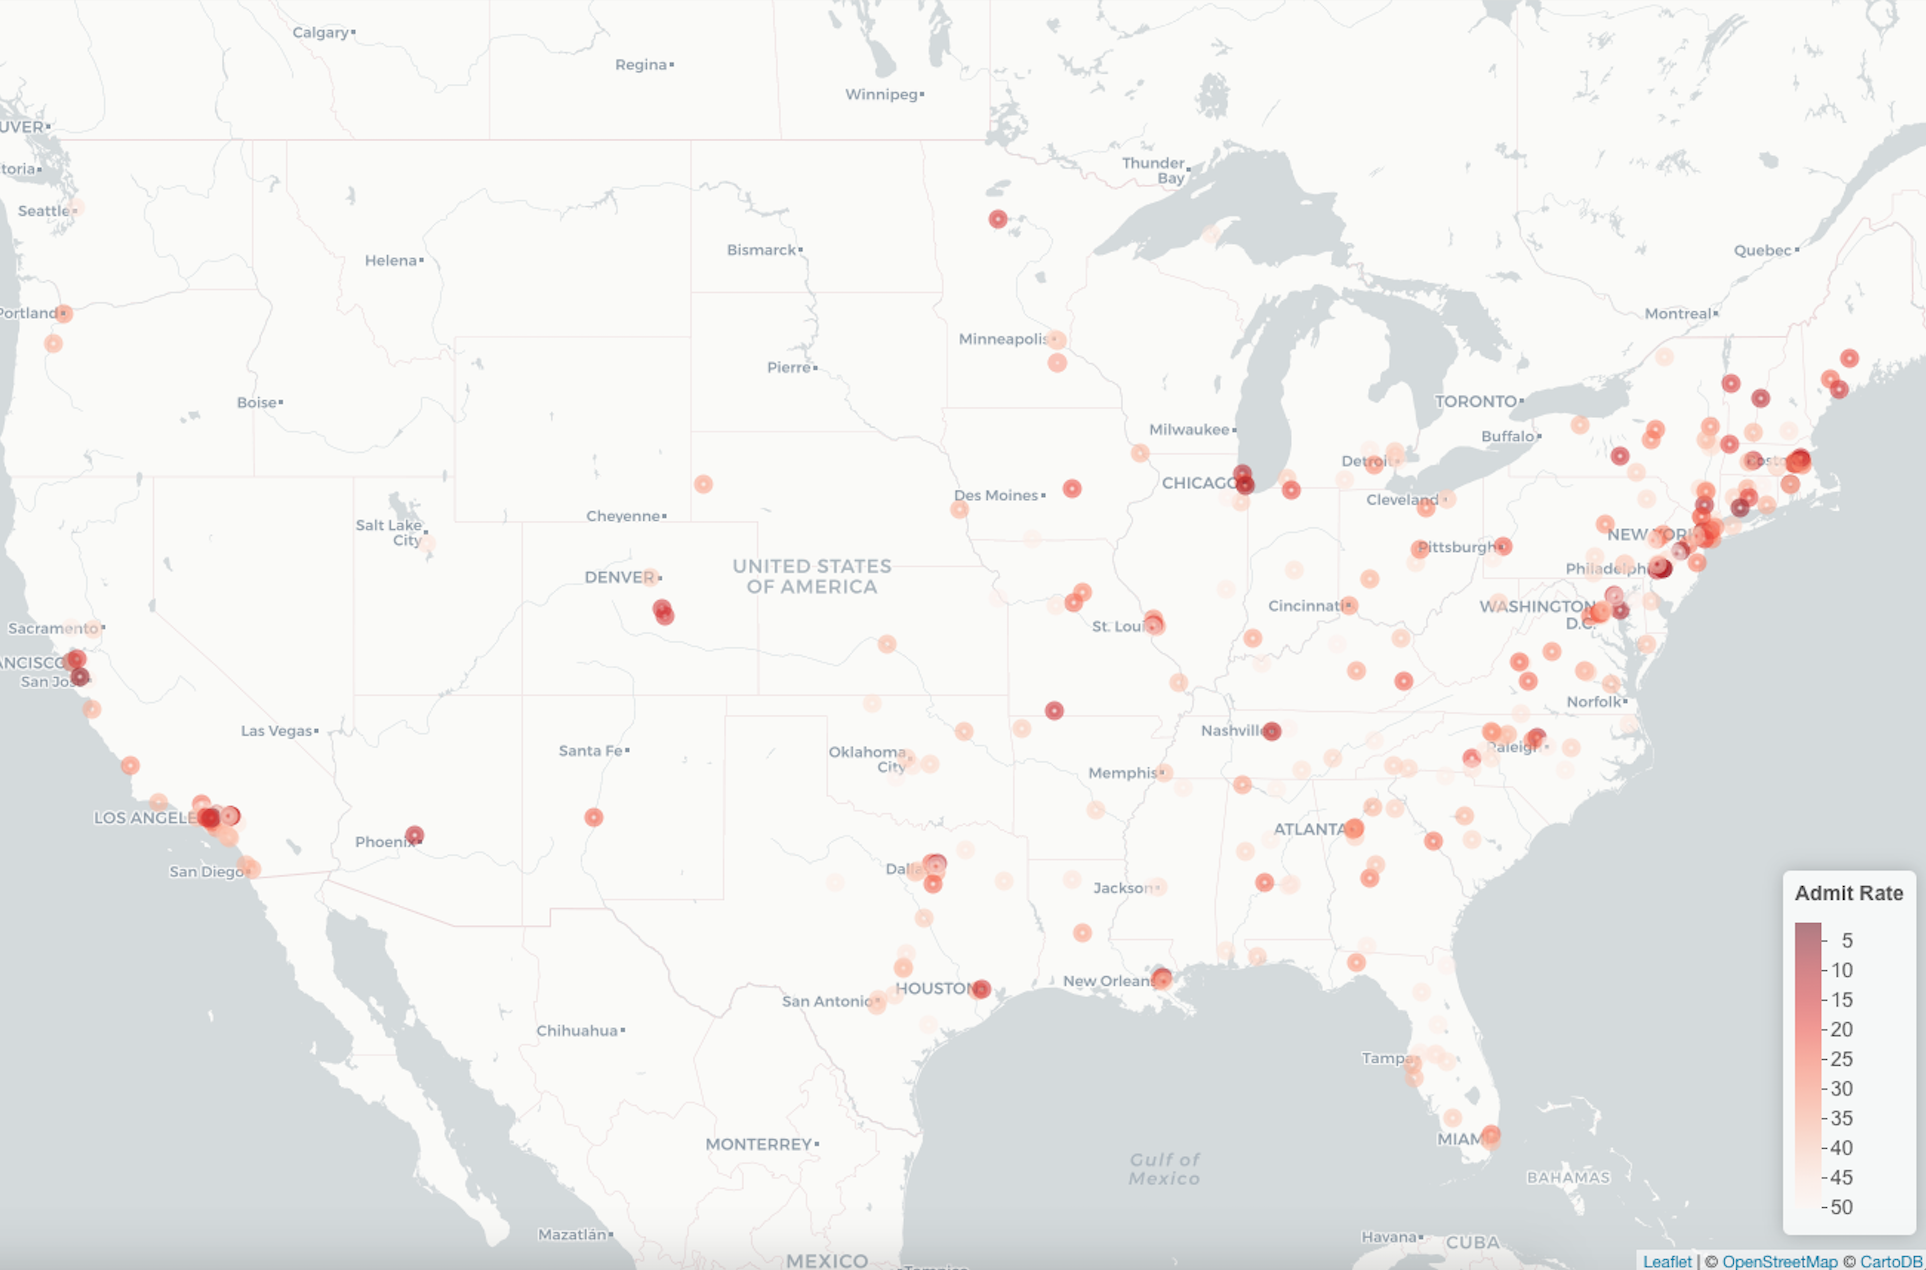
Color Coding Colleges
Interactive Maps with leaflet in R

Rich Majerus
Vice President of Strategy & Planning, Queens University of Charlotte
Adding Color (and Information)
Remembering your Colors
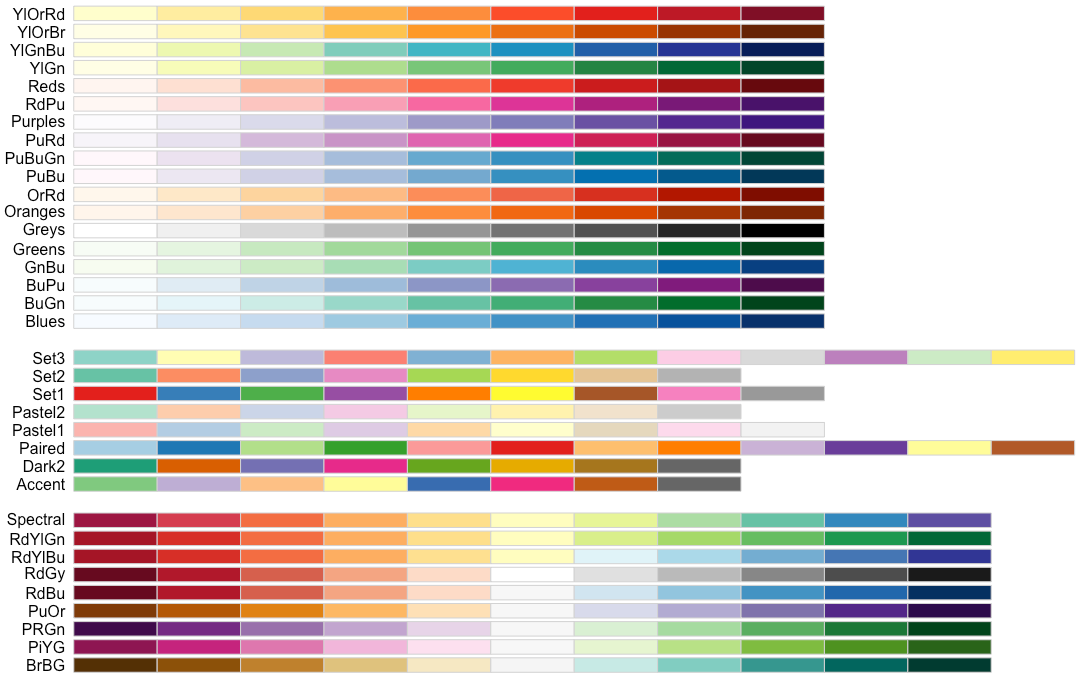
Picking a Color Palette
# see https://colorbrewer2.org/ for interactive examples
library(RColorBrewer)
display.brewer.all()