Mapping Polygons
Interactive Maps with leaflet in R

Rich Majerus
Vice President of Strategy & Planning, Queens University of Charlotte
Plotting Polygons
shp %>%
  leaflet() %>%
  addTiles() %>%
  addPolygons()
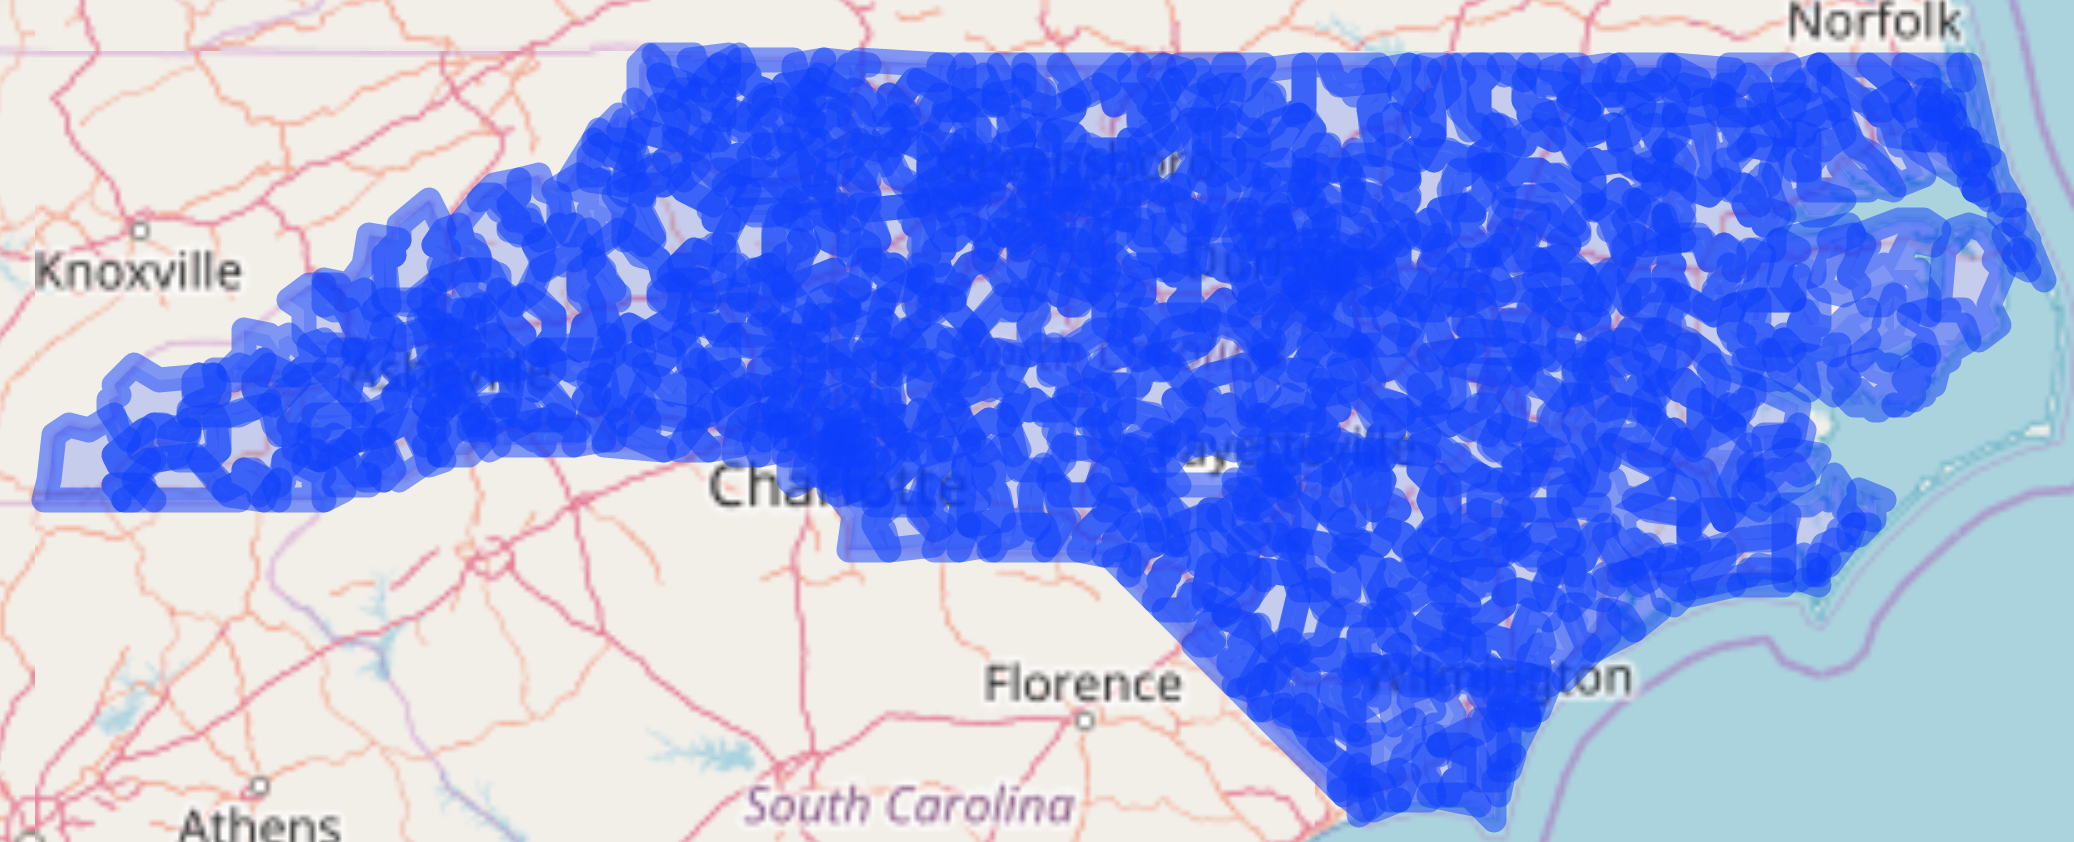
addPolygons()
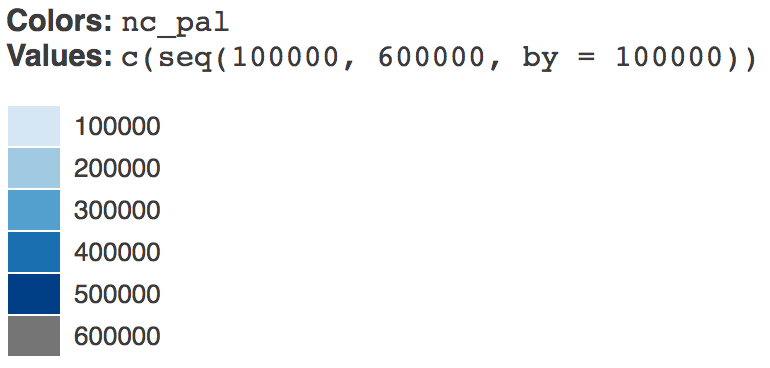
colorNumeric()
nc_pal <- colorNumeric("Blues", domain = high_inc@data$mean_income)previewColors(pal = nc_pal, values = c(seq(100000, 600000, by = 100000)))
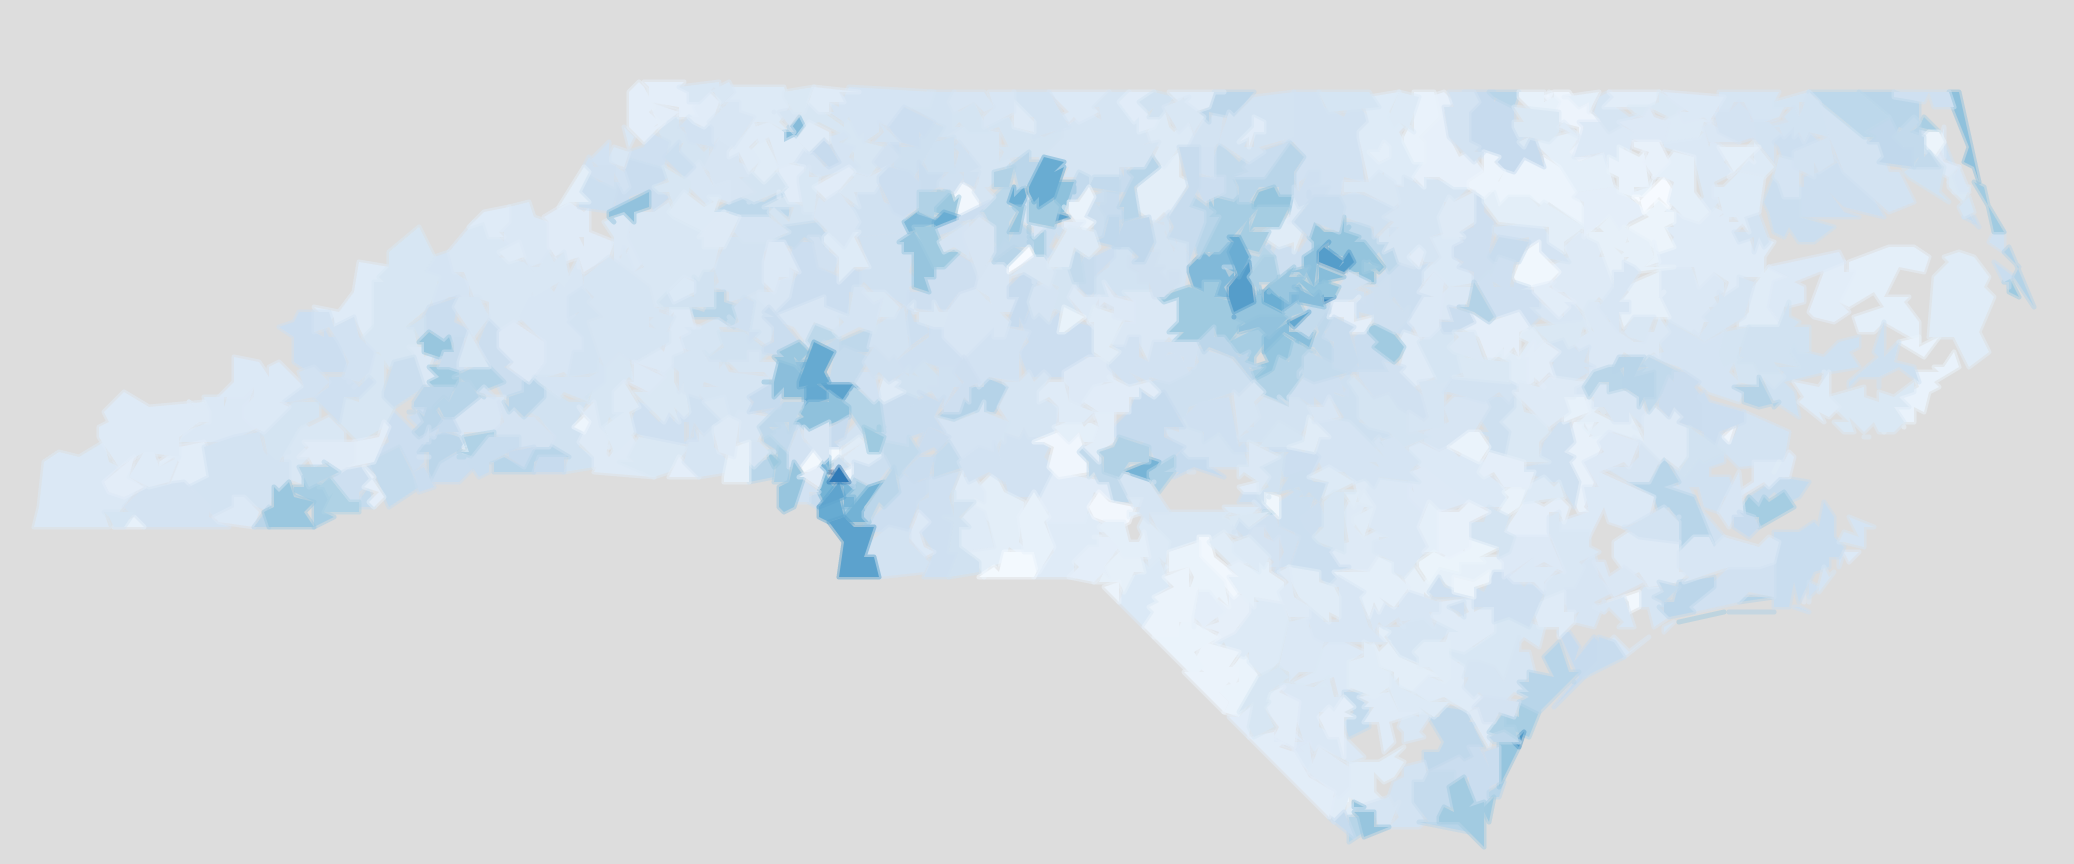
Choropleth Map
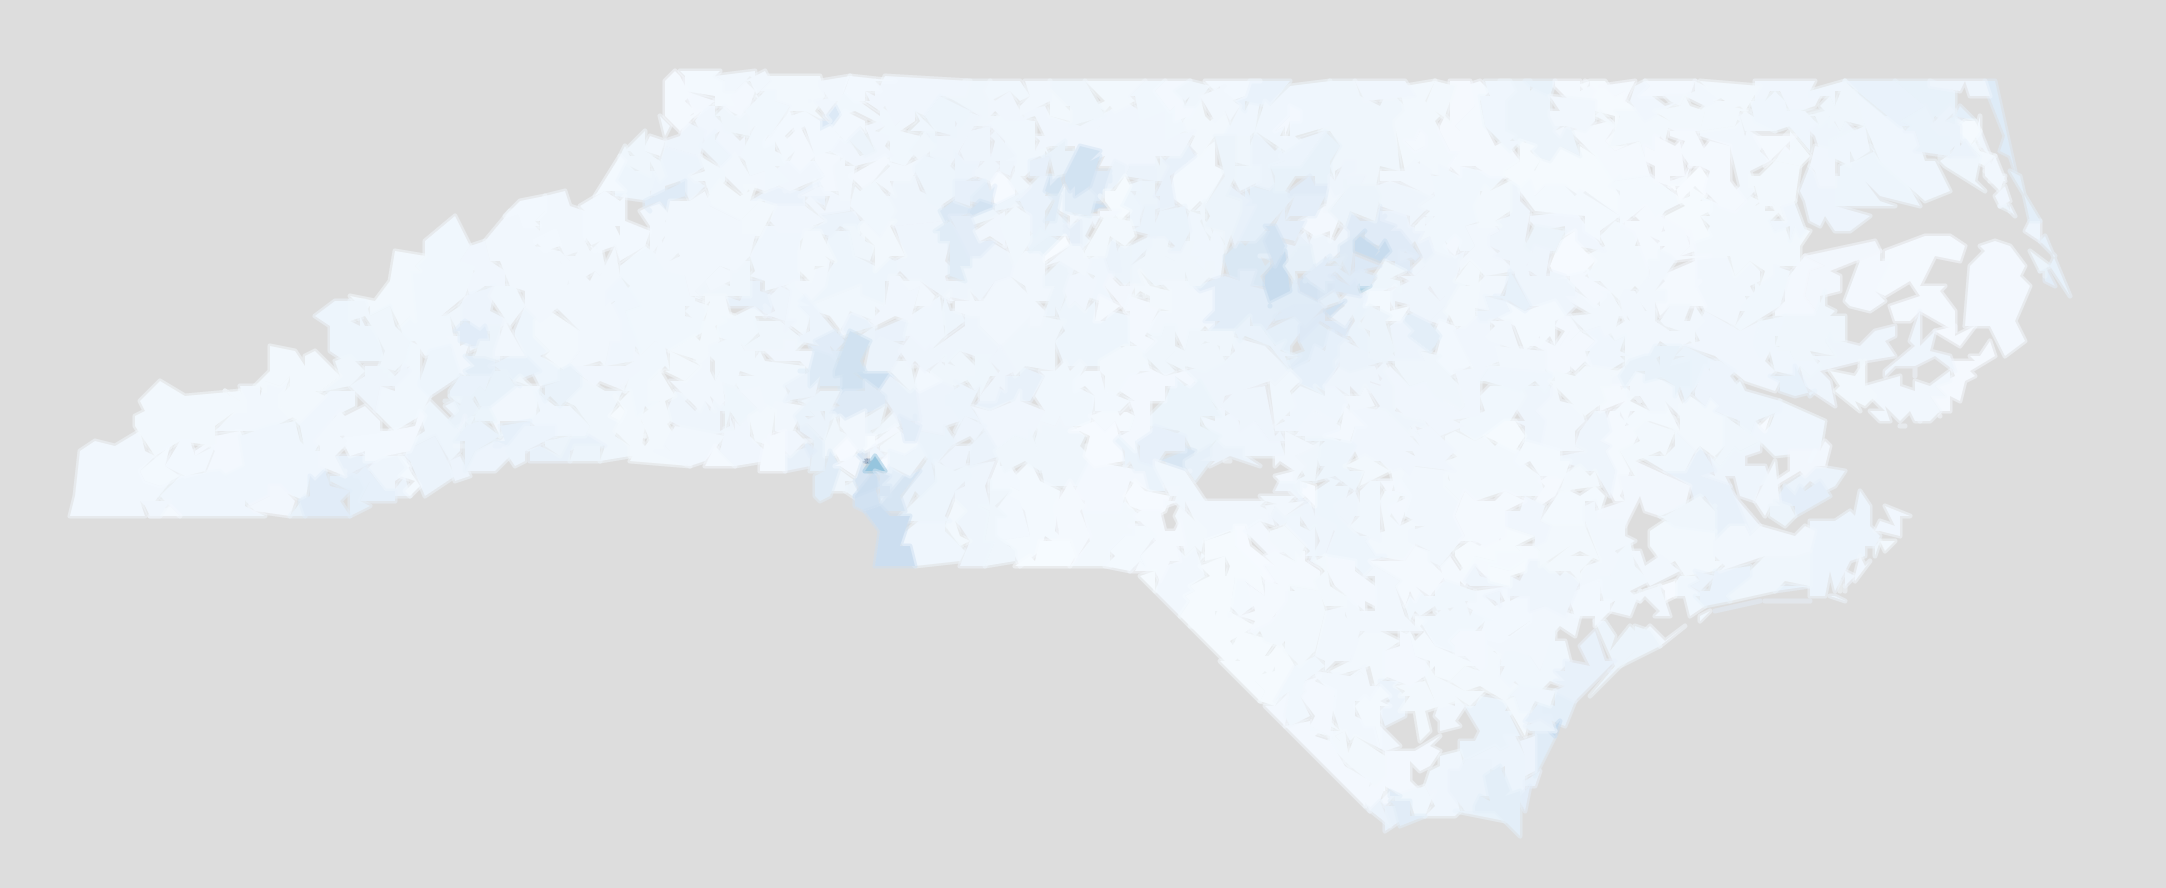
Choropleth Example
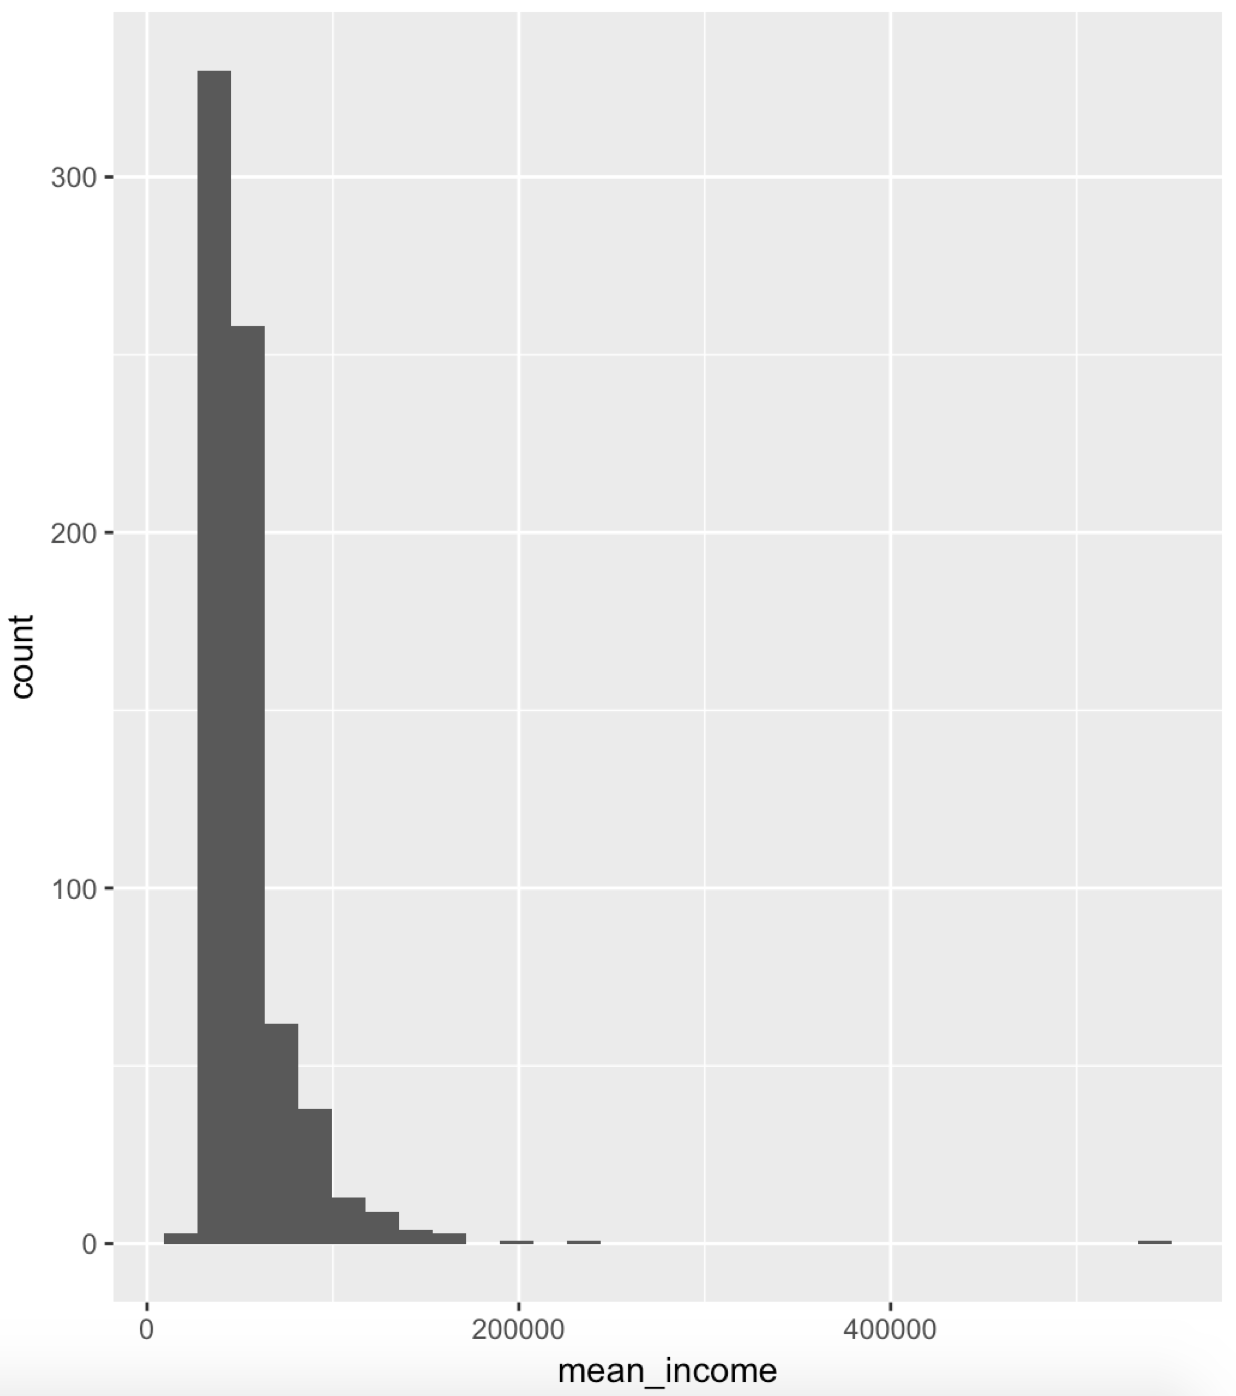
ggplot(shp@data,
       aes(mean_income)) +
  geom_histogram()
ggplot(shp@data,
        aes(log(mean_income))) +
  geom_histogram()
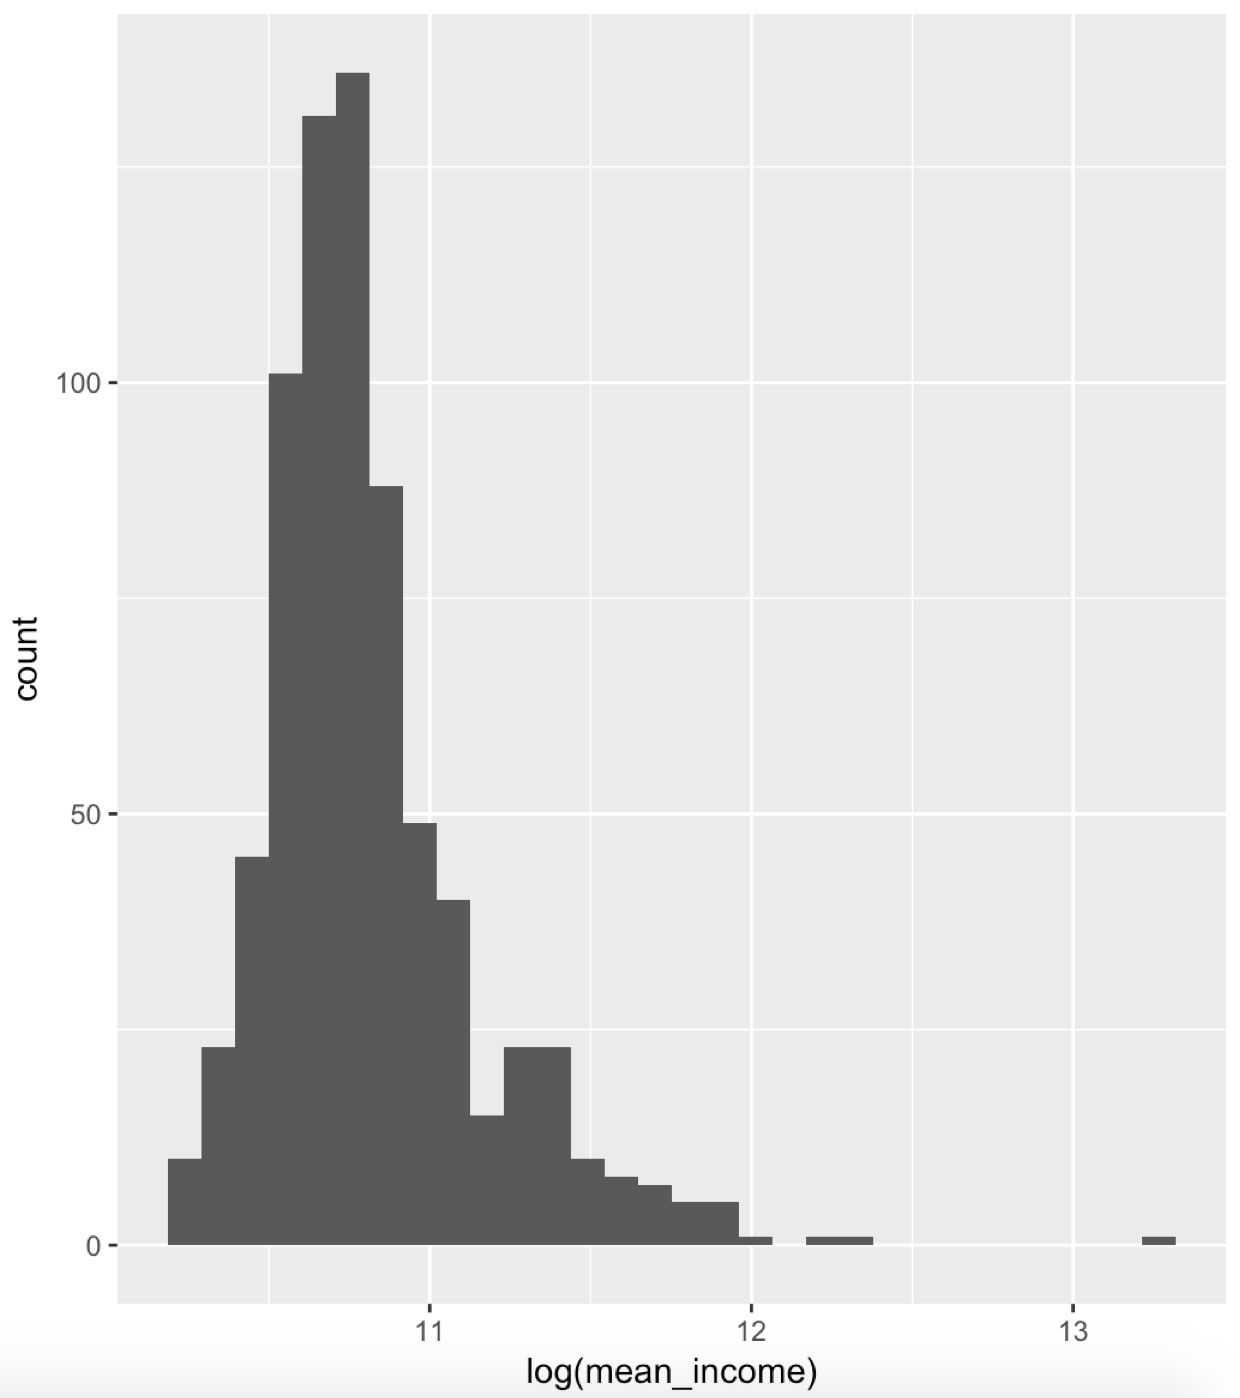
Logging