Chapter 2 Overview
Interactive Maps with leaflet in R

Rich Majerus
Vice President of Strategy & Planning, Queens University of Charlotte
Where We Left Off
leaflet() %>%
    addProviderTiles("CartoDB") %>%
    addMarkers(lng = dc_hq$lon, lat = dc_hq$lat, popup = dc_hq$hq)
Cleaning up the Base Map
m <- m %>%
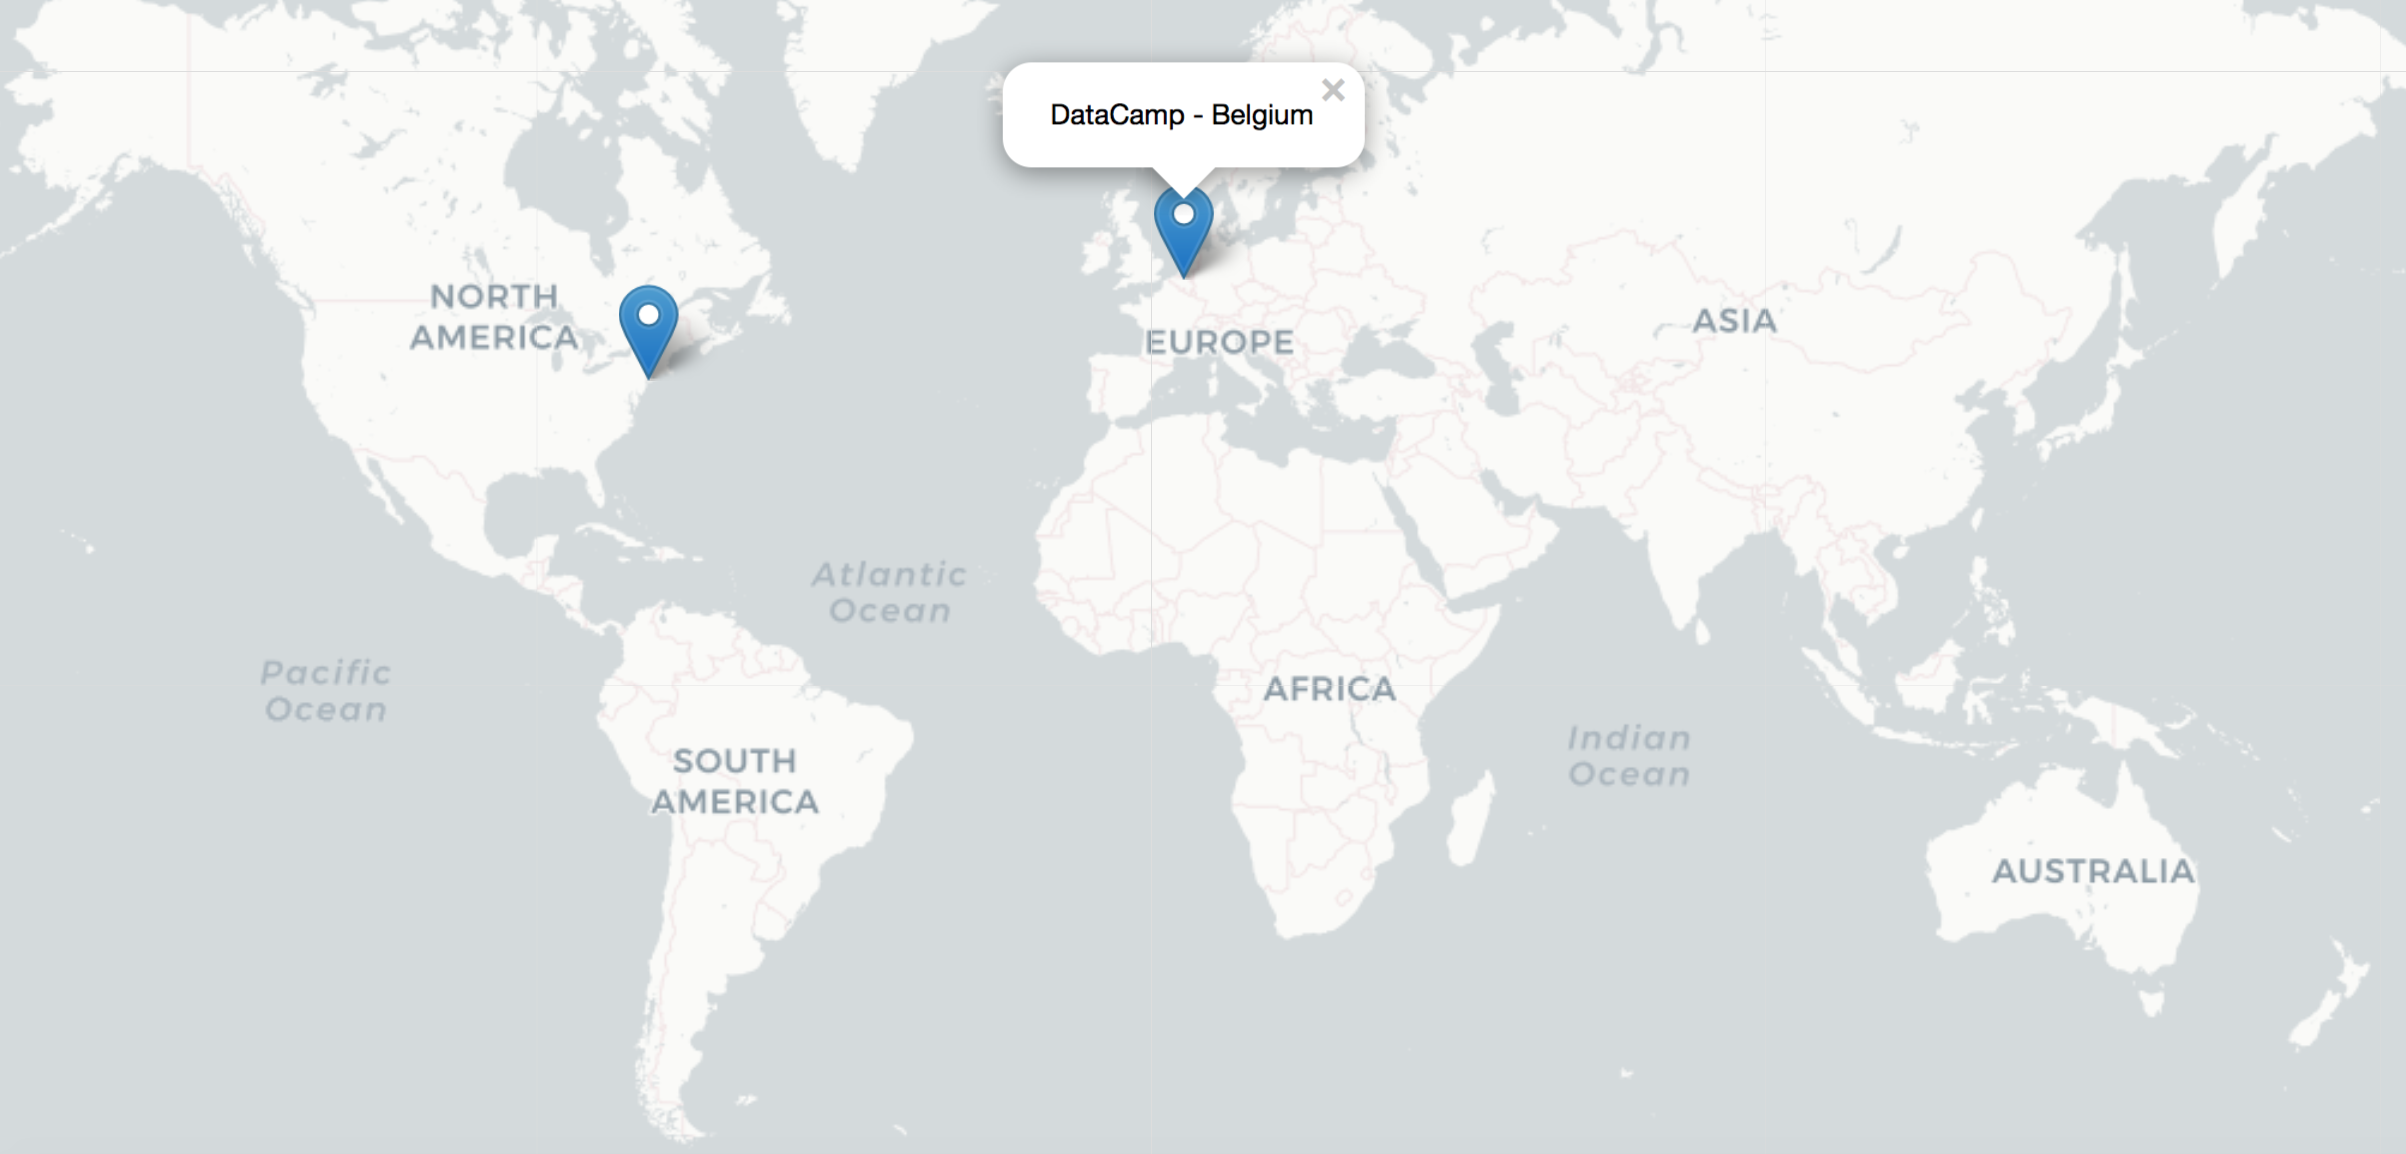
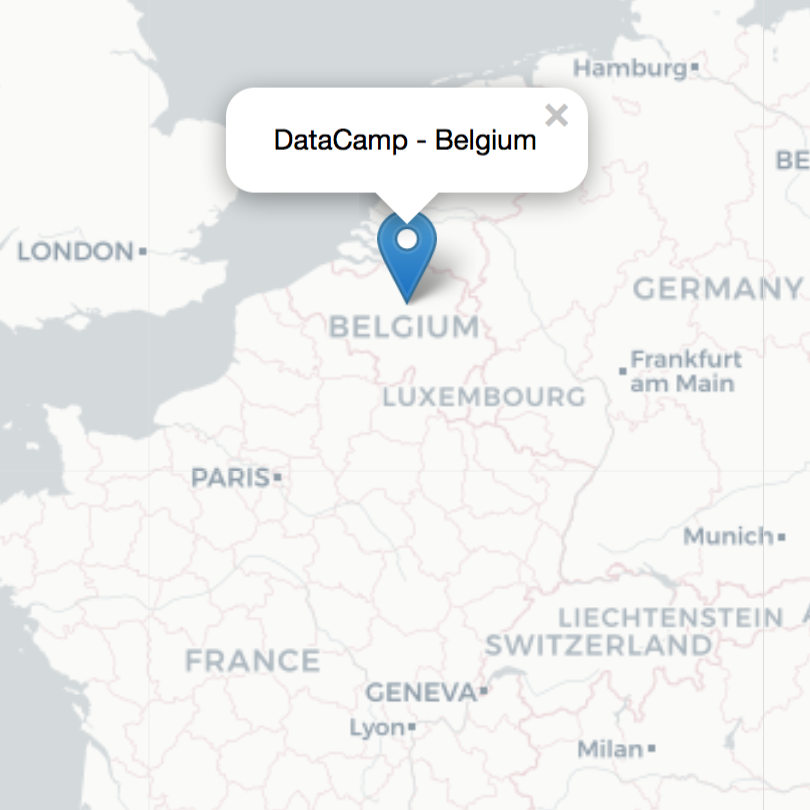
setView(lat = 50.881363,
lng = 4.717863,
zoom = 5)
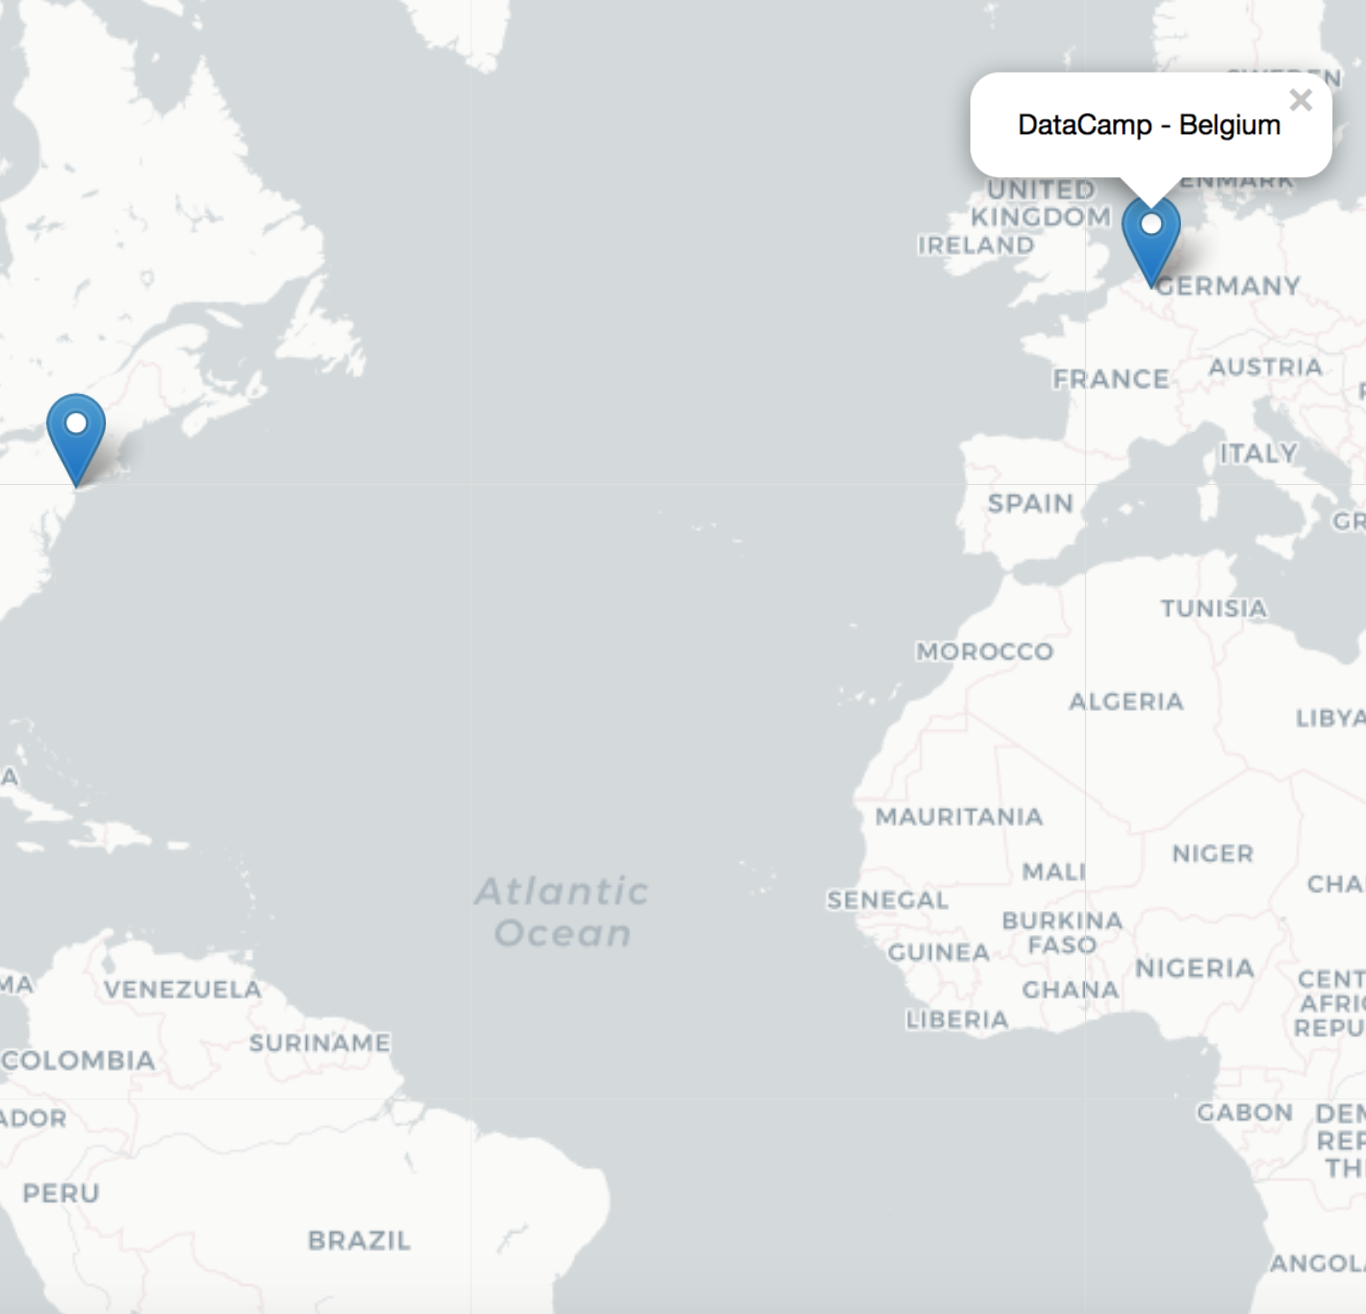
# Restore view based on
# data displayed on map
m  %>%
    clearBounds()
Cleaning up the Base Map
# Restore view based on
# data displayed on map
m  %>%
    clearBounds()
# Remove markers
m  %>%
    clearBounds() %>%
    clearMarkers()
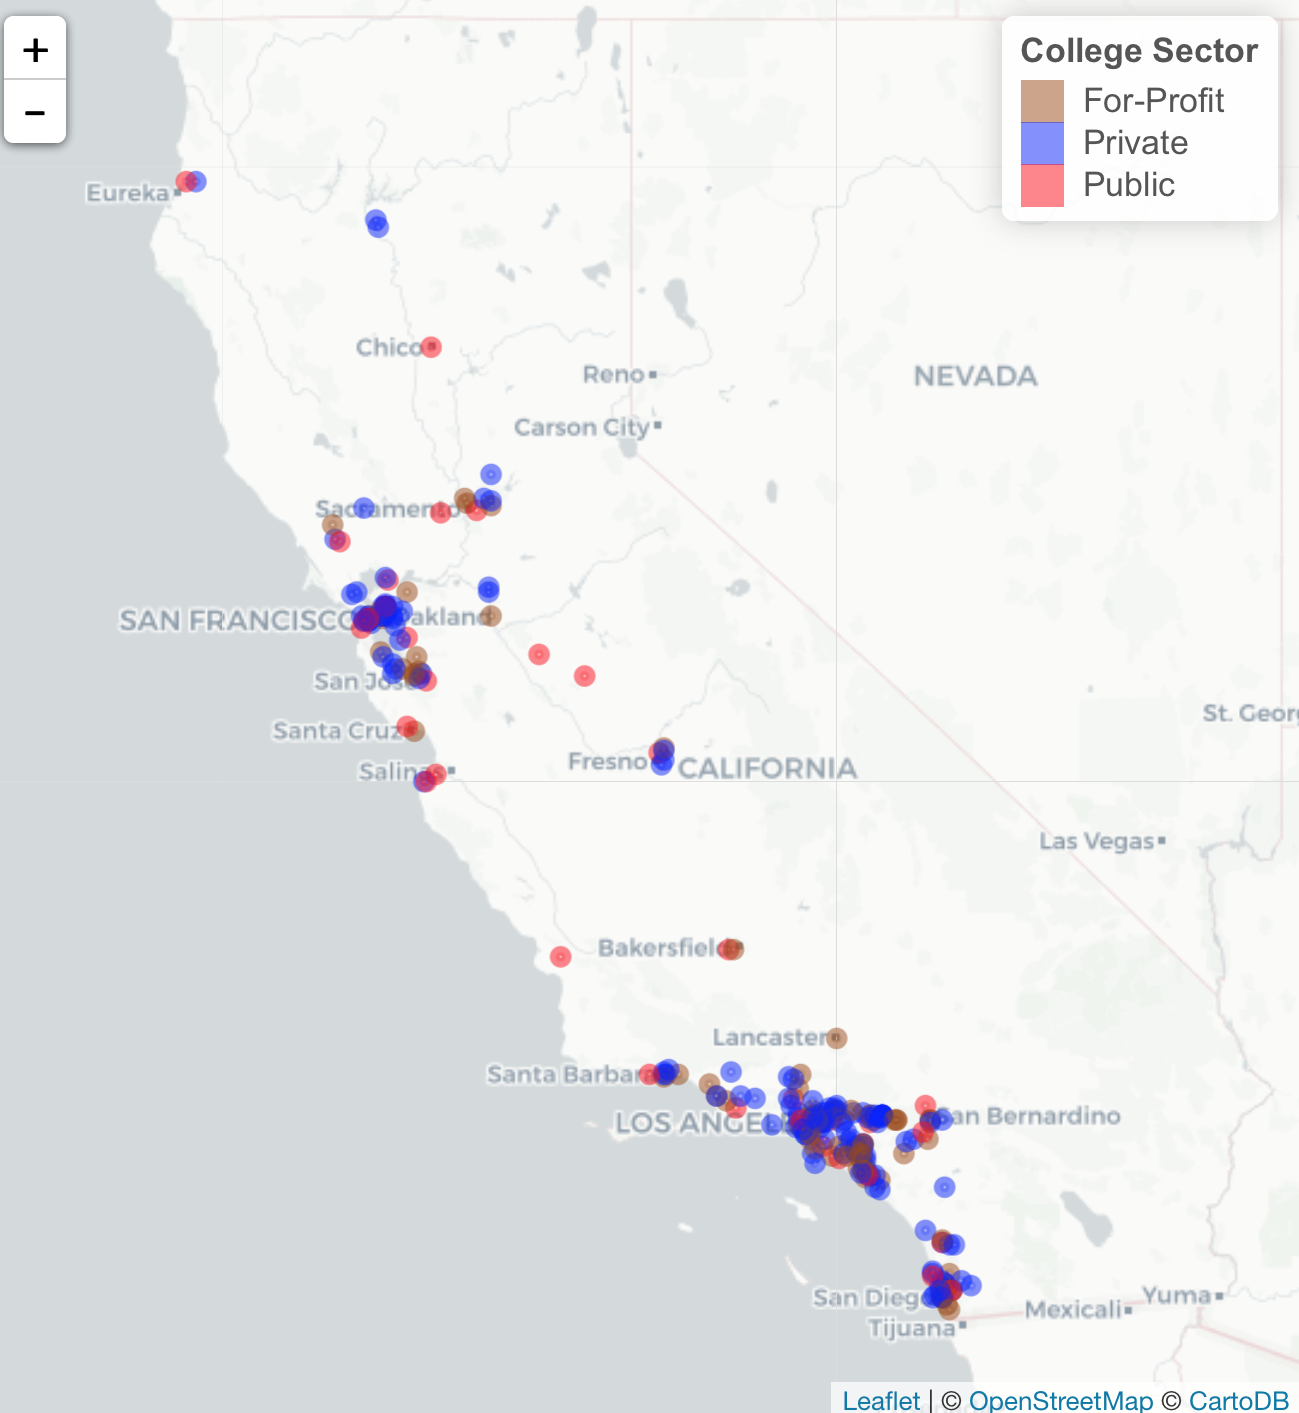
Where We are Going in Chapter 2