Setting the Default Map View
Interactive Maps with leaflet in R

Rich Majerus
Vice President of Strategy & Planning, Queens University of Charlotte
Setting the Default Map View
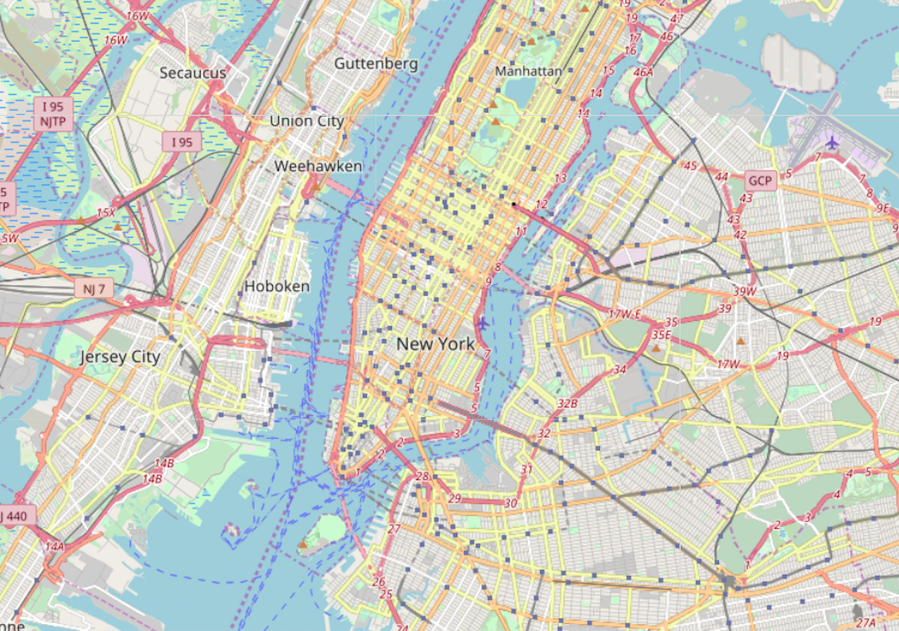
setView()
leaflet() %>%
 addTiles() %>%
 setView(lng = -73.98575,
         lat = 40.74856,
         zoom = 13)
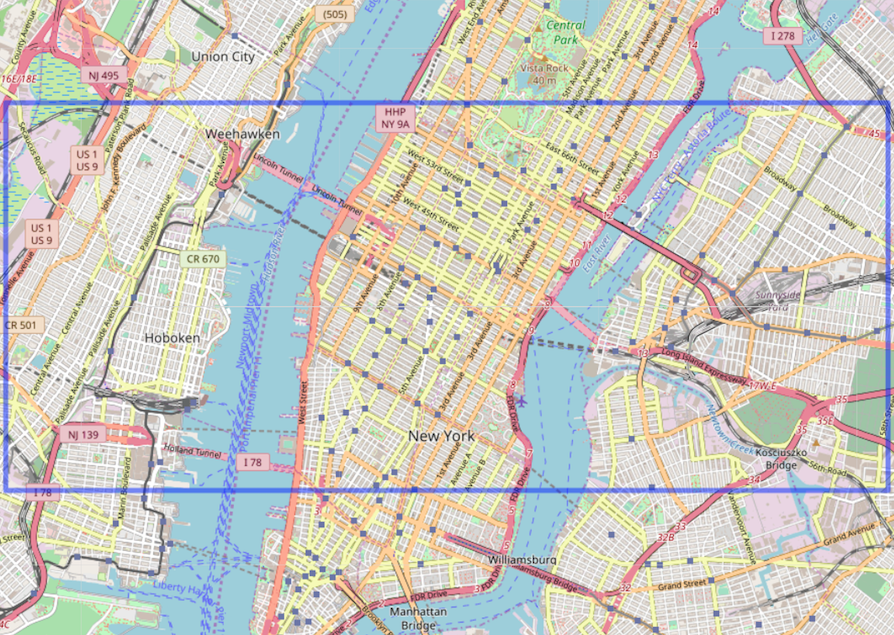
fitBounds()
leaflet() %>%
 addTiles() %>%
 fitBounds(
  lng1 = -73.910, lat1 = 40.773,
  lng2 = -74.060, lat2 = 40.723)
Restoring Focus
leaflet()  %>%
     addTiles()  %>%
     setView(lng = -73.98575, lat = 40.74856, zoom = 18) %>%
     setMaxBounds(lng1 = -73.98575, lat1 = 40.74856,
                  lng2 = -73.98575, lat2 = 40.74856)