Base Groups

Interactive Maps with leaflet in R

Rich Majerus

Vice President of Strategy & Planning, Queens University of Charlotte

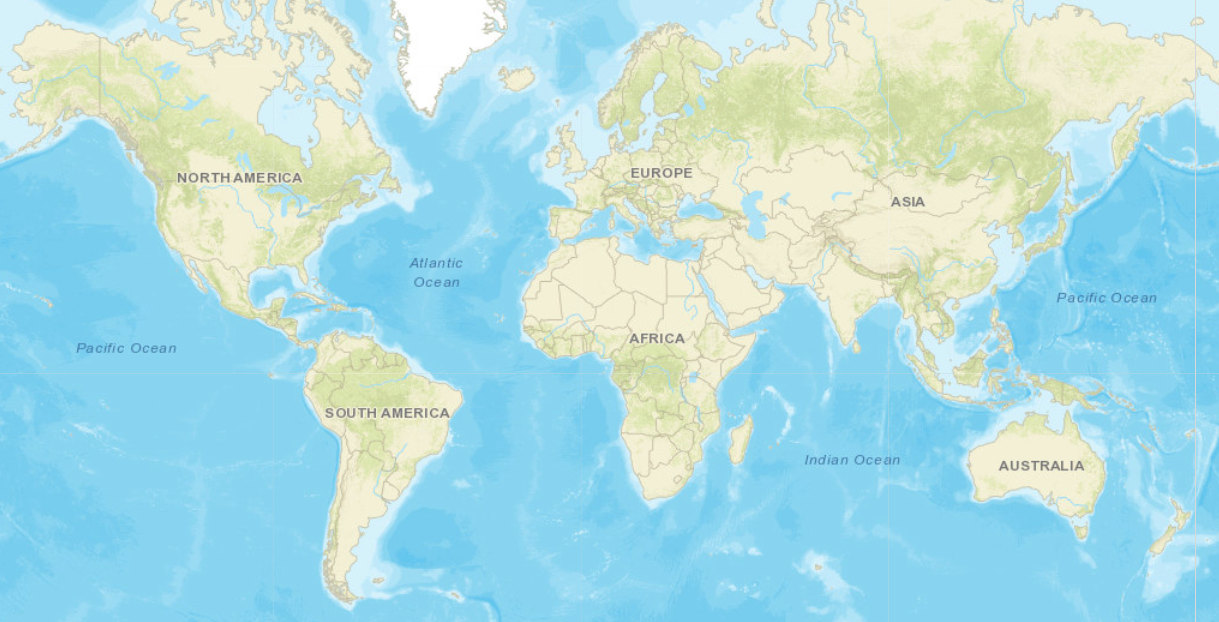
Base Groups and Multiple Map Tiles

leaflet() %>% 
  addTiles(group = "OSM") %>% 
  addProviderTiles("CartoDB", group = "Carto") %>% 
  addProviderTiles("Esri", group = "Esri")

Base groups 1

Interactive Maps with leaflet in R
leaflet() %>% 
  addTiles(group = "OSM") %>% 
  addProviderTiles("CartoDB", group = "Carto") %>% 
  addProviderTiles("Esri", group = "Esri")  %>% 

addLayersControl(baseGroups = c("OSM", "Carto", "Esri"), position = "topleft")

Base groups 2

Interactive Maps with leaflet in R

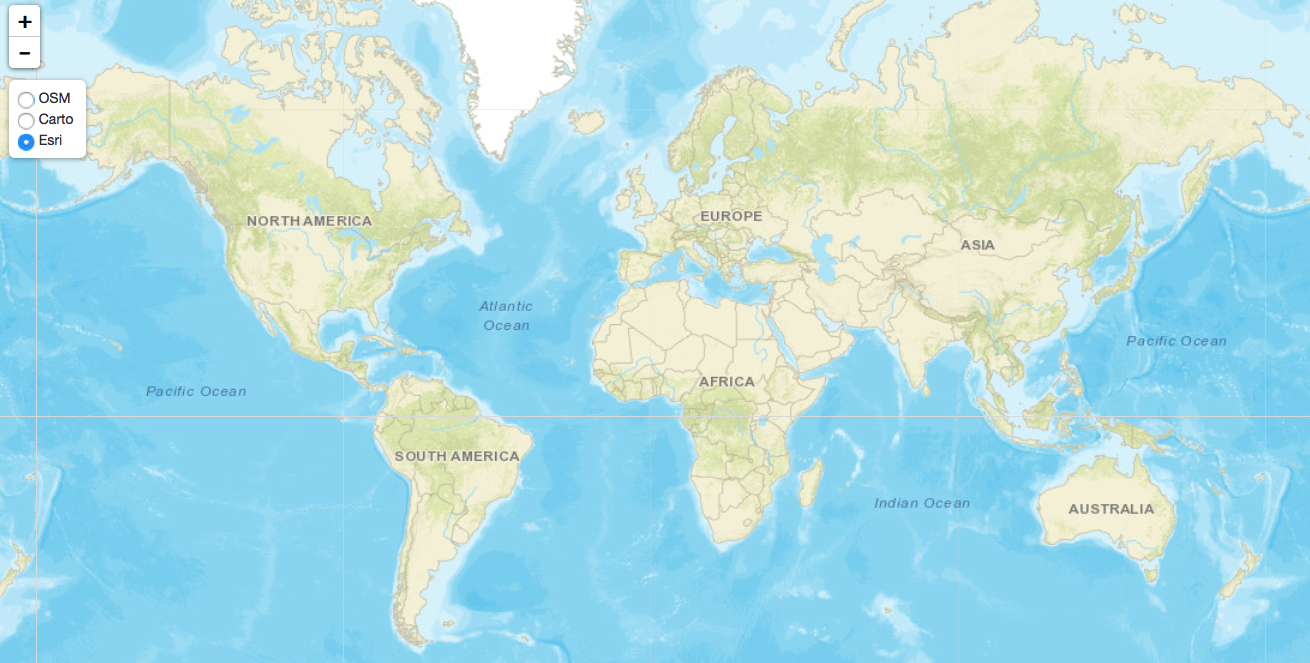
Exploring Esri Base Maps

Base groups 3

Interactive Maps with leaflet in R

Overlay and Base Groups

# initialize leaflet map
leaflet() %>%

# add basemaps with groups addTiles(group = "OSM") %>% addProviderTiles("CartoDB", group = "Carto") %>% addProviderTiles("Esri", group = "Esri") %>%
Interactive Maps with leaflet in R

Overlay and Base Groups

# add marker layer for each sector with corresponding group name
addCircleMarkers(data = public, radius = 2, 
                 label = ~htmlEscape(name),
                 color = ~pal(sector_label), group = "Public") %>% 
addCircleMarkers(data = private, radius = 2, 
                 label = ~htmlEscape(name),
                 color = ~pal(sector_label), group = "Private") %>% 
addCircleMarkers(data = profit, radius = 2, 
                 label = ~htmlEscape(name),
                 color = ~pal(sector_label), group = "For-Profit") %>% 

# add layer controls for base and overlay groups addLayersControl(baseGroups = c("OSM", "Carto", "Esri"), overlayGroups = c("Public", "Private", "For-Profit"))
Interactive Maps with leaflet in R

The Big Reveal

All four year colleges with base and overlay groups

Interactive Maps with leaflet in R

Let's practice!

Interactive Maps with leaflet in R

Preparing Video For Download...