DESeq2 results
RNA-Seq with Bioconductor in R

Mary Piper
Bioinformatics Consultant and Trainer
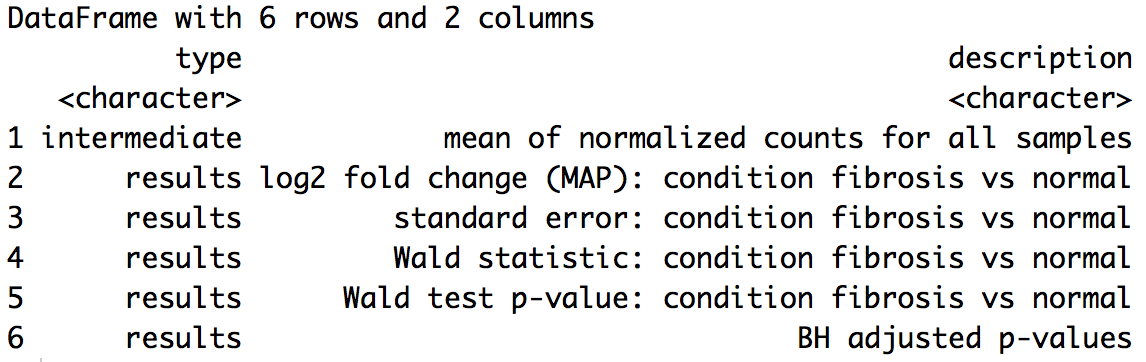
DESeq2 results table
mcols(wt_res)
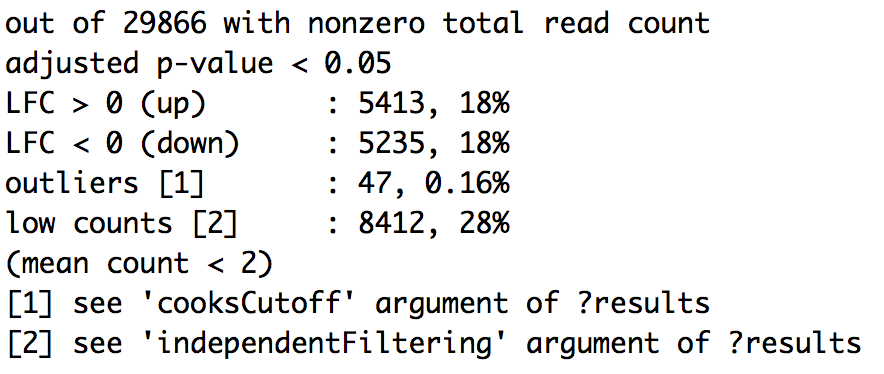
Significant DE genes - summary
summary(wt_res)
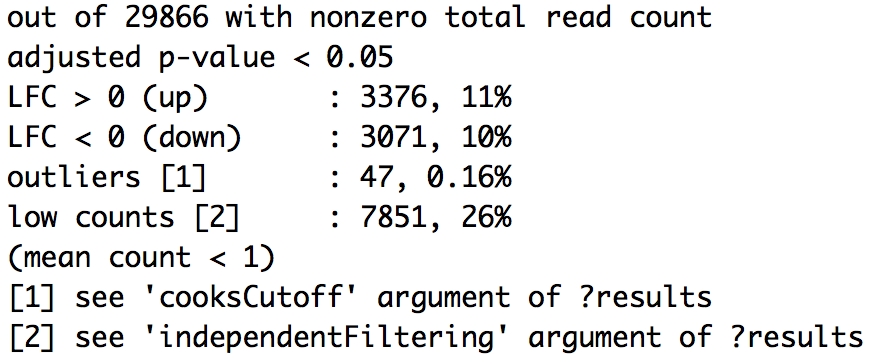
Significant DE genes - summary
summary(wt_res)
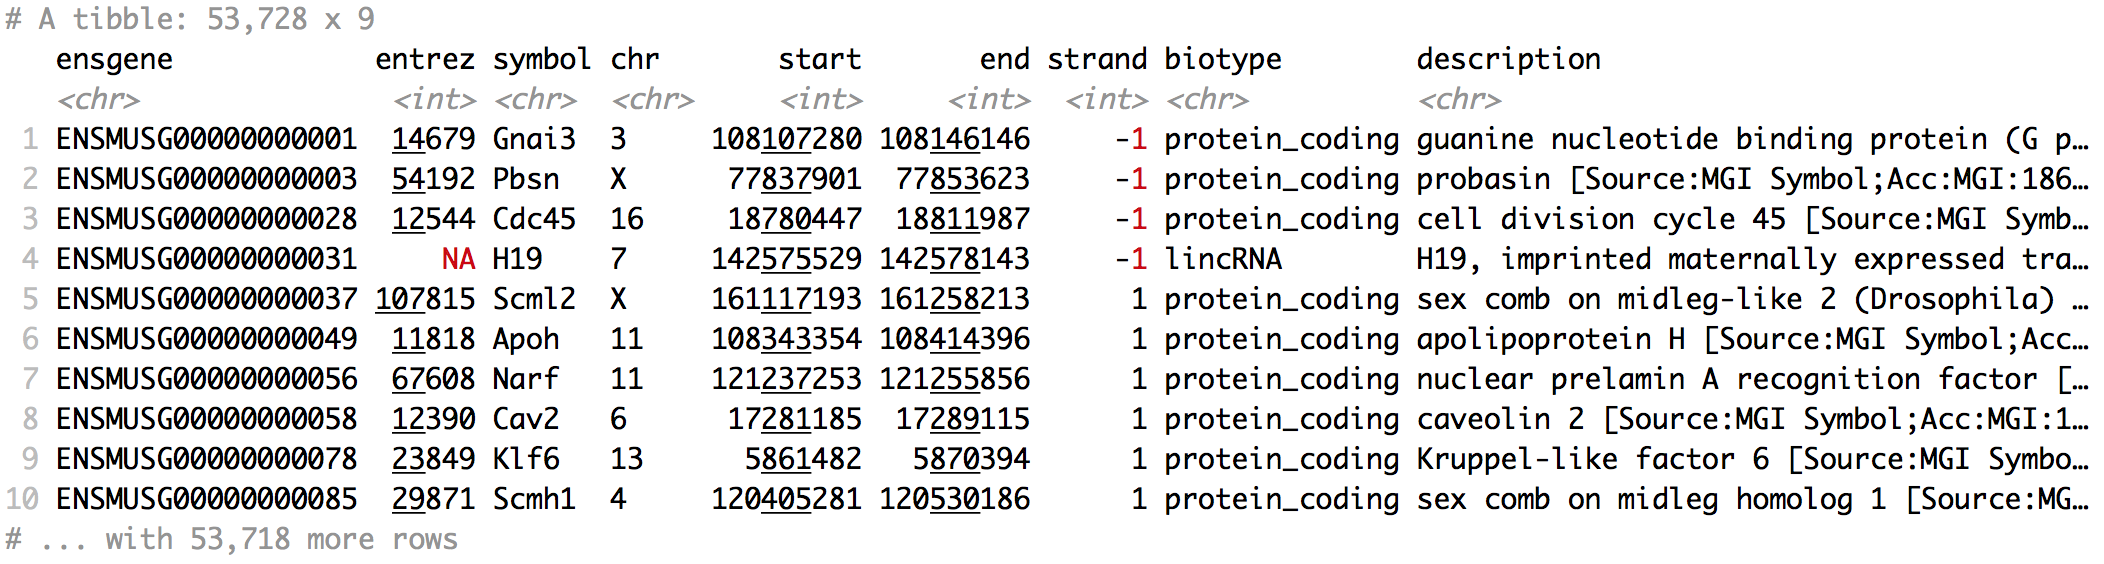
Results - annotate
library(annotables)

grcm38
Results - extract
wt_res_all <- data.frame(wt_res) %>%
              rownames_to_column(var = "ensgene") %>%
              left_join(x = wt_res_all,
                        y = grcm38[, c("ensgene", "symbol", "description")],
                        by = "ensgene")
View(wt_res_all)
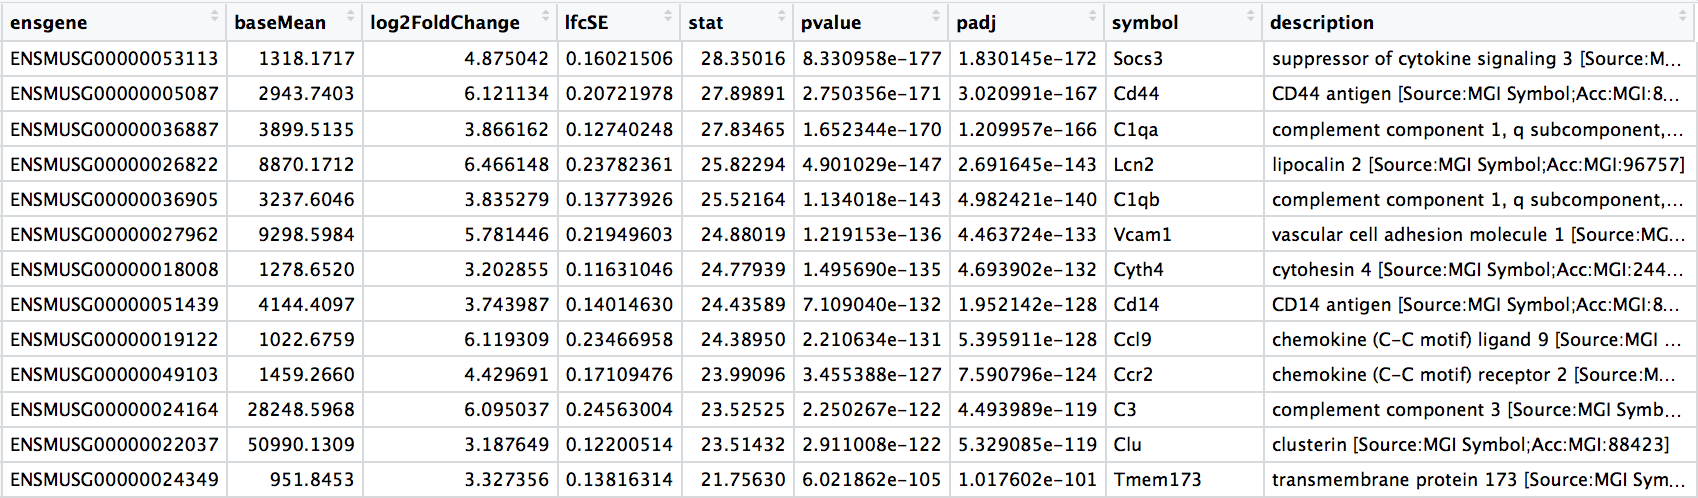
Significant DE genes - arrange
wt_res_sig <- subset(wt_res_all, padj < 0.05)wt_res_sig <- wt_res_sig %>% arrange(padj)View(wt_res_all)