Differential gene expression overview
RNA-Seq with Bioconductor in R

Mary Piper
Bioinformatics Consultant and Trainer

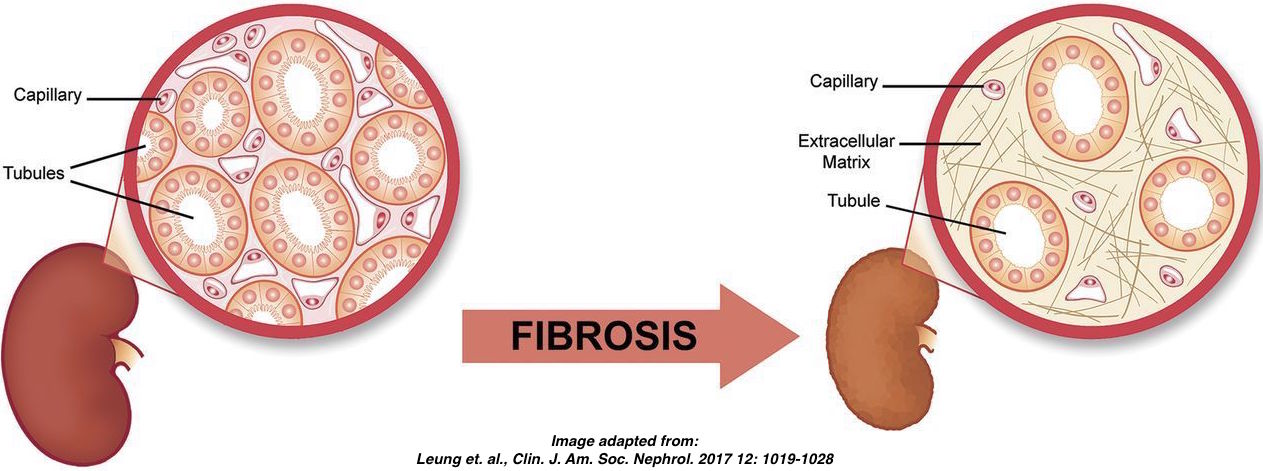
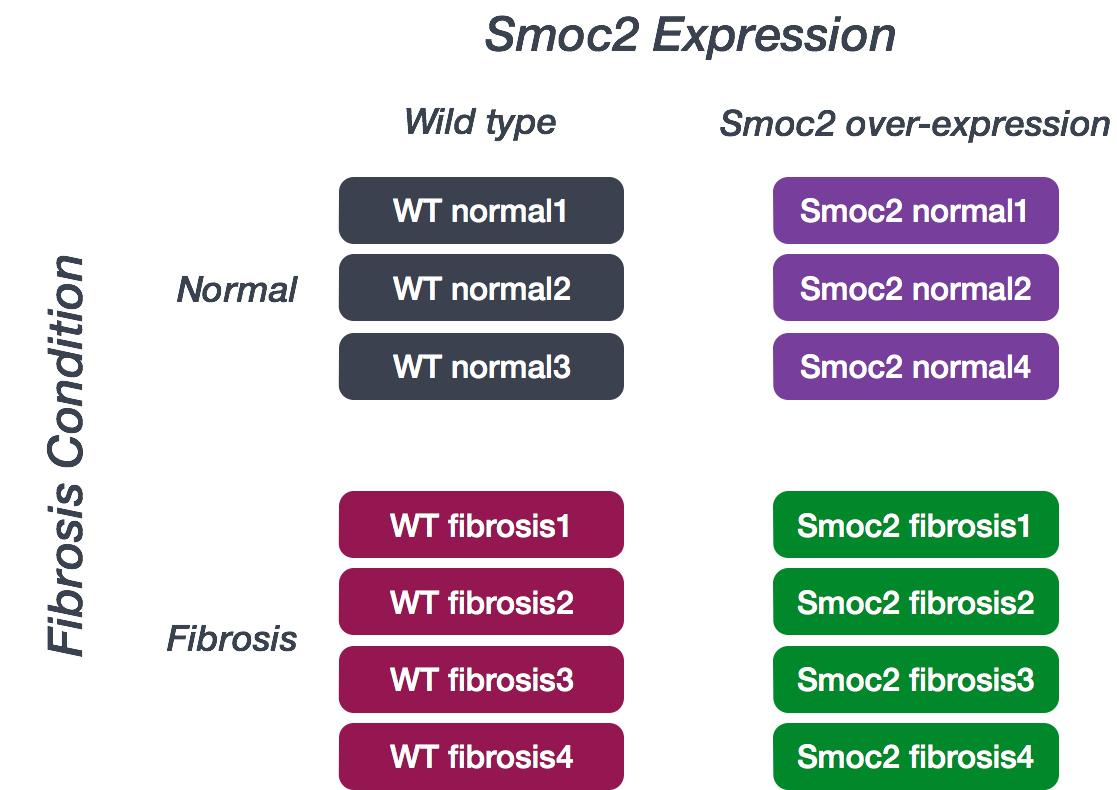
Introduction to dataset: Smoc2
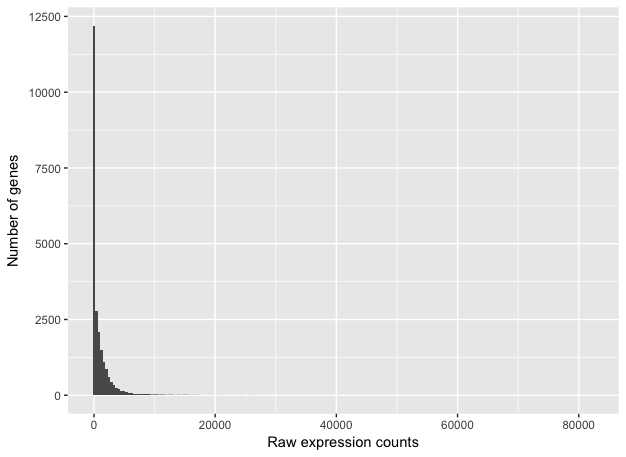
RNA-Seq count distribution
ggplot(raw_counts) +
  geom_histogram(aes(x = wt_normal1), stat = "bin", bins = 200) +
  xlab("Raw expression counts") +
  ylab("Number of genes")
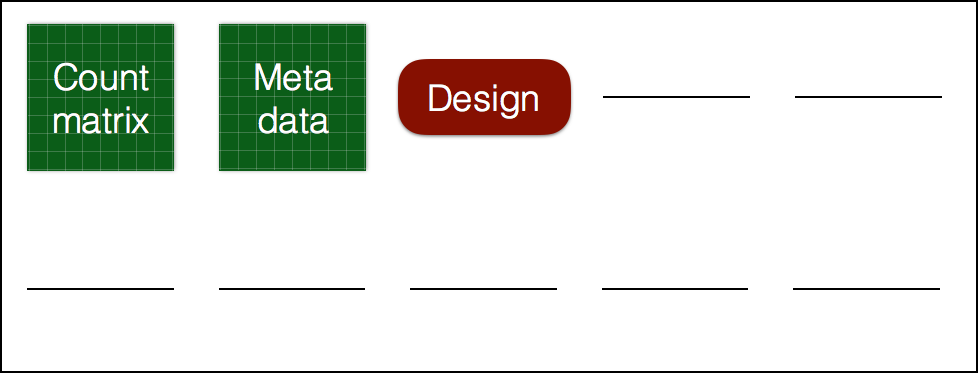
Preparation for differential expression analysis: DESeq2 object
dds <- DESeqDataSetFromMatrix(countData = rawcounts,
                        colData = metadata,
                        design = ~ condition)
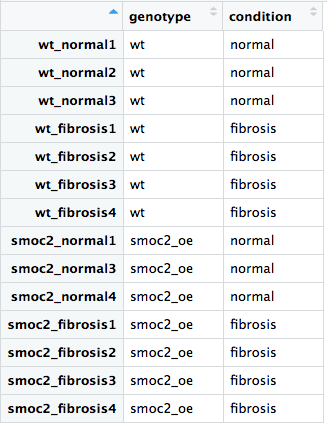
Preparation for differential expression analysis: metadata