Exploring the weather dataset
Analyzing Police Activity with pandas

Kevin Markham
Founder, Data School
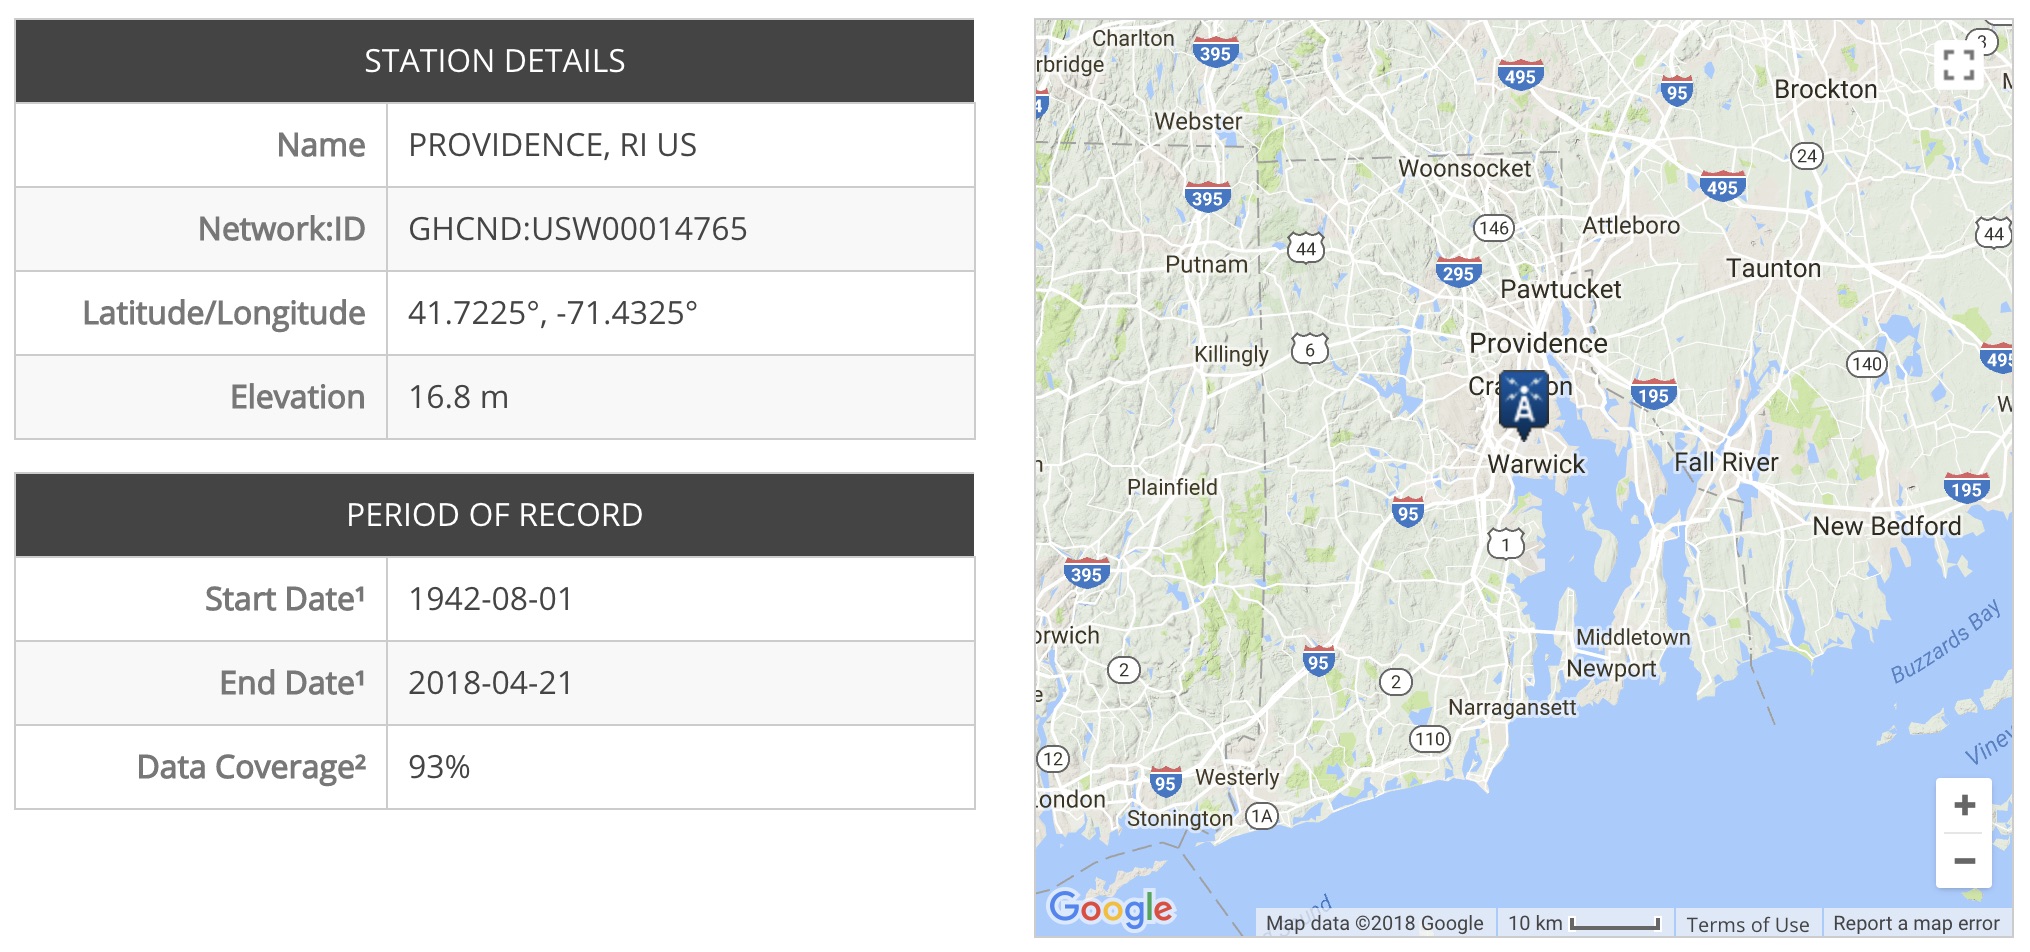
Introduction to the dataset

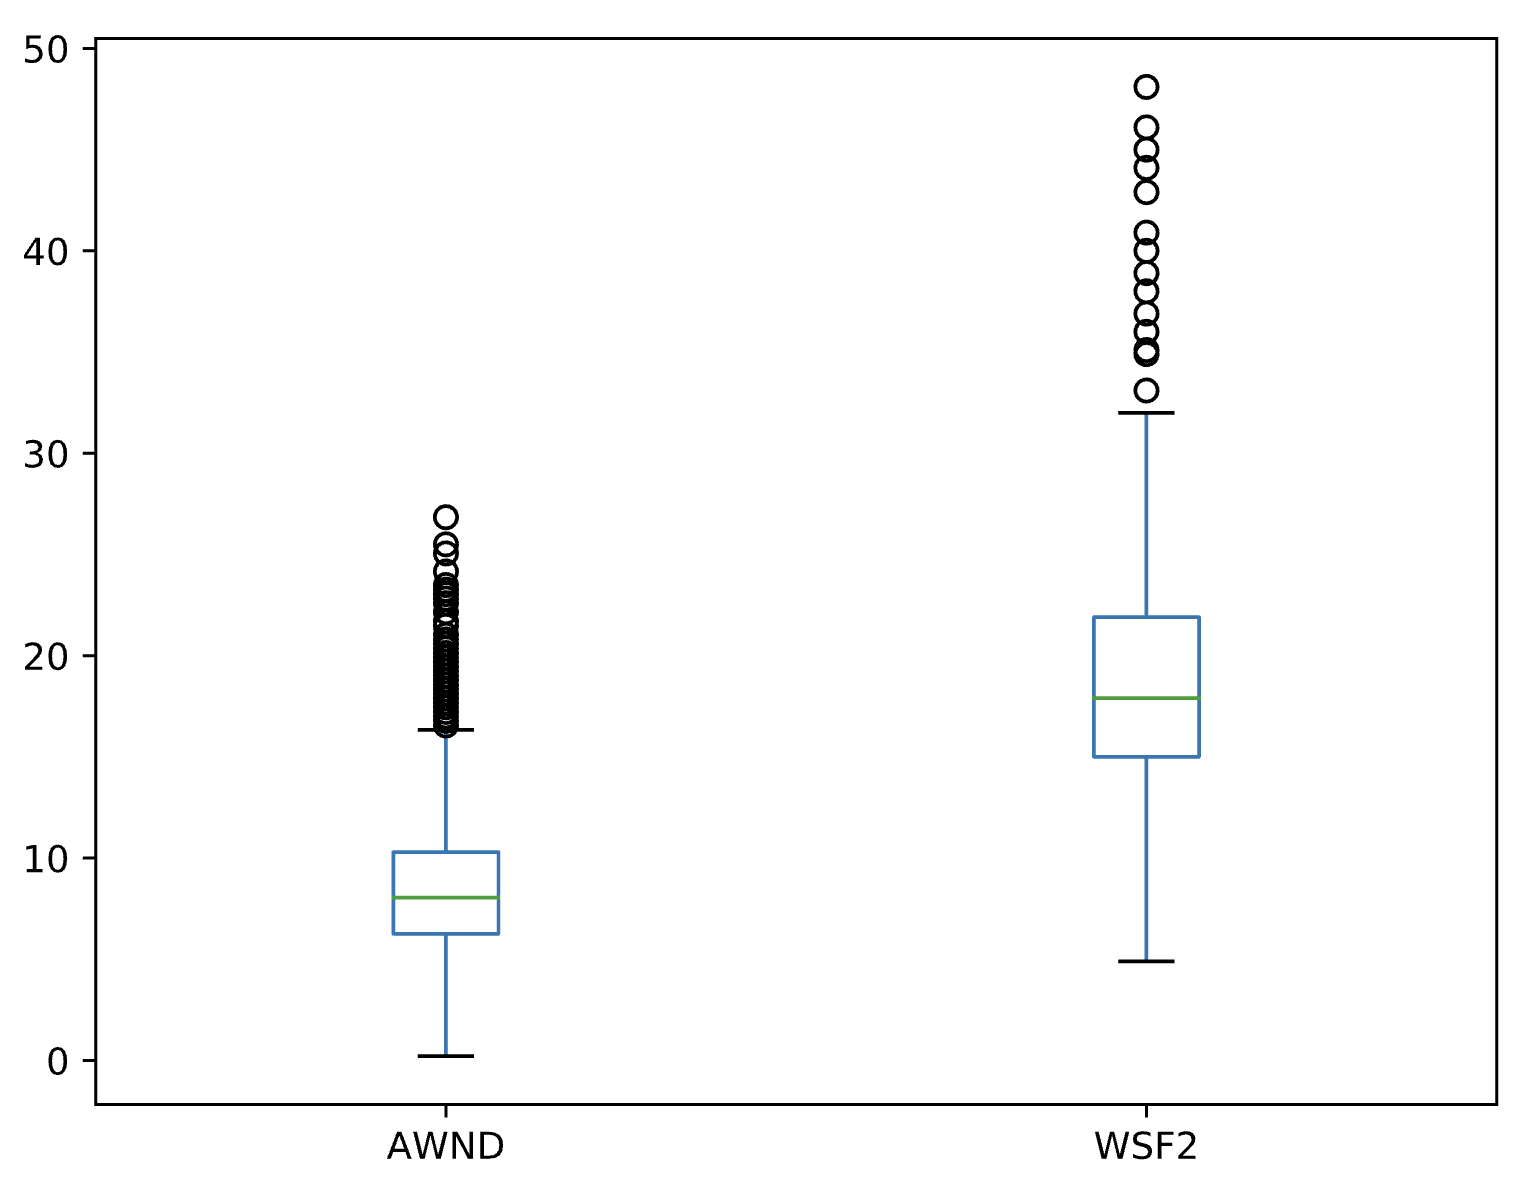
Creating a box plot
weather[['AWND', 'WSF2']].plot(kind='box')
plt.show()
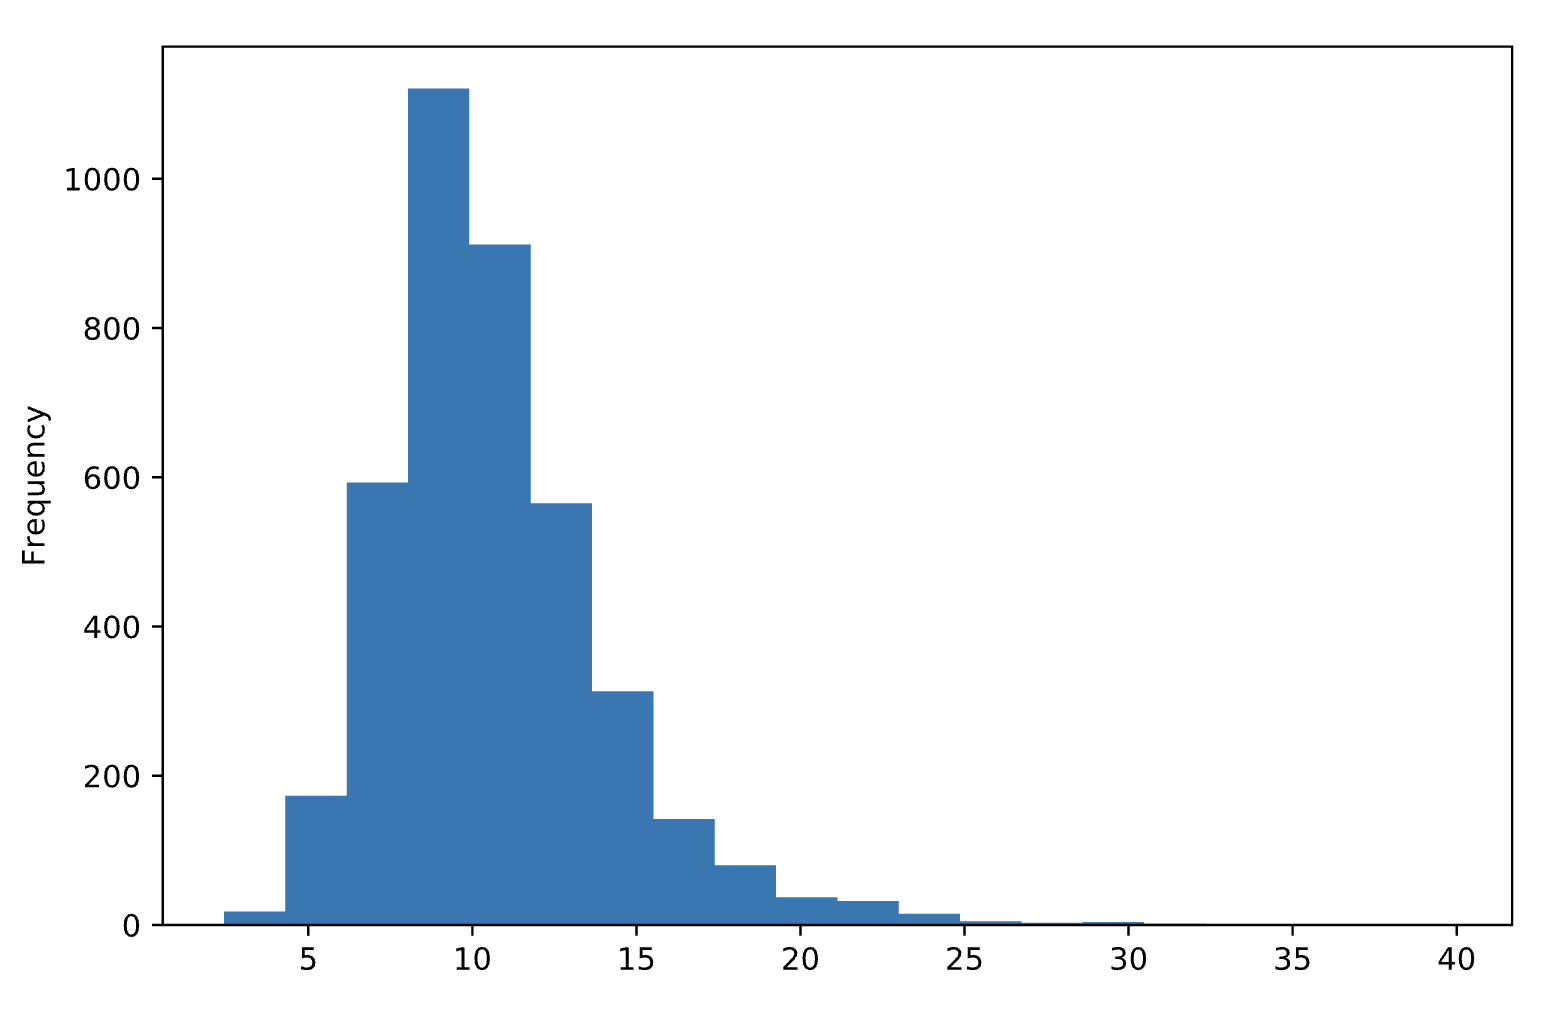
Creating a histogram (1)
weather['WDIFF'] = weather.WSF2 - weather.AWNDweather.WDIFF.plot(kind='hist') plt.show()
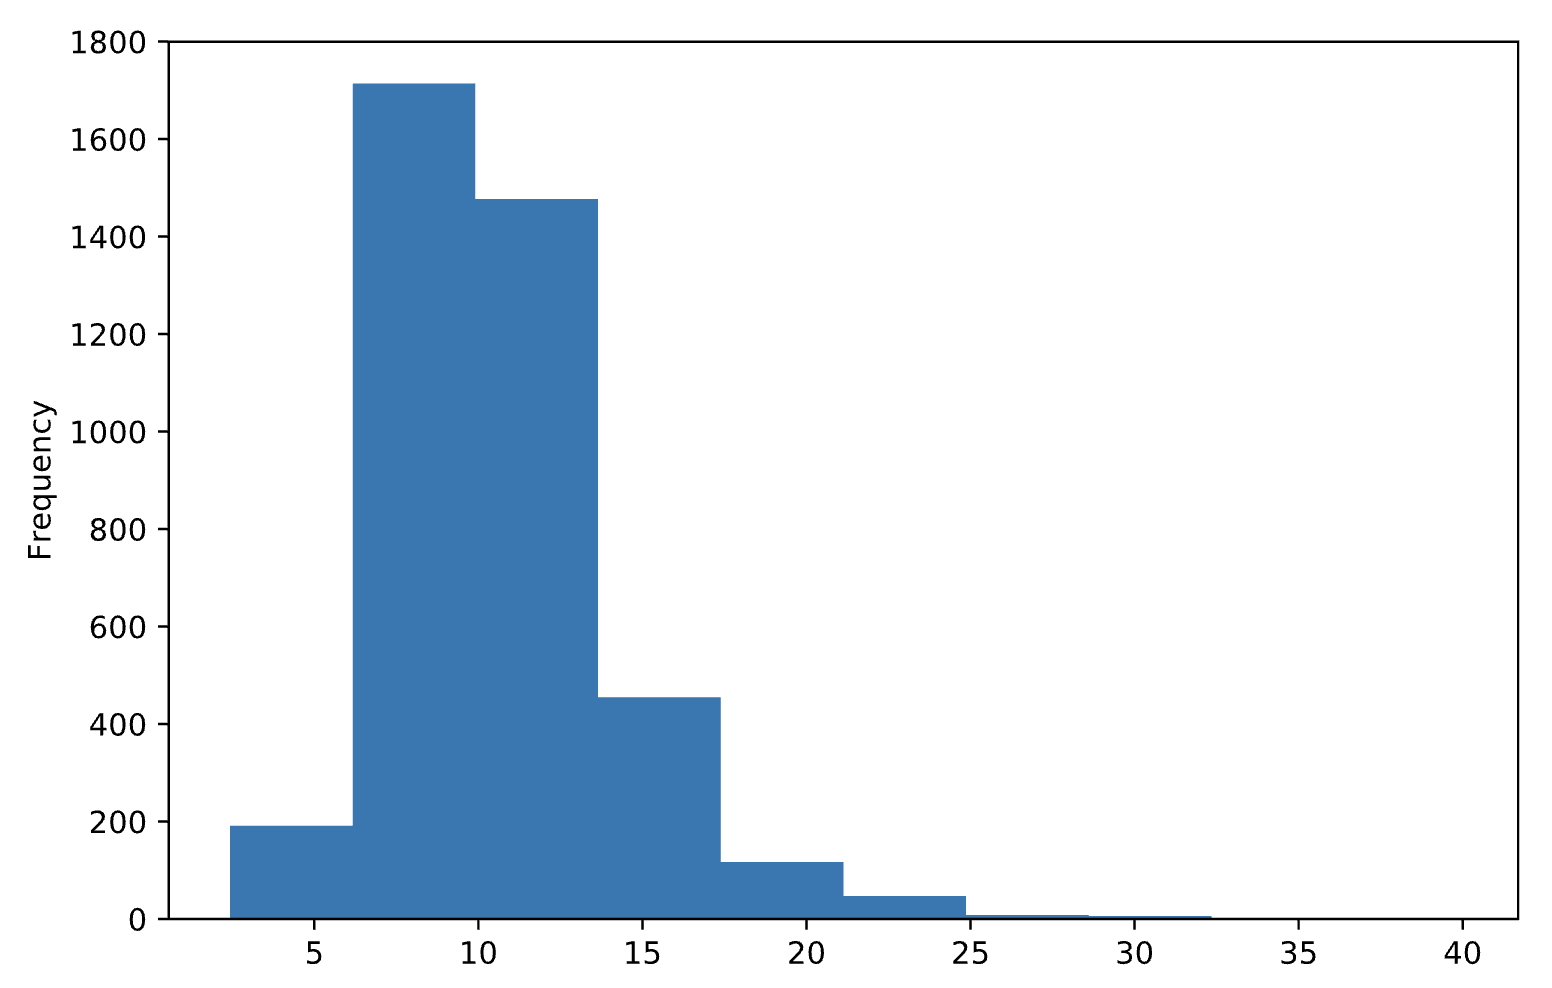
Creating a histogram (2)
weather.WDIFF.plot(kind='hist', bins=20)
plt.show()