Are drug-related stops on the rise?

Analyzing Police Activity with pandas

Kevin Markham

Founder, Data School

Resampling the price

apple.groupby(apple.index.month).price.mean()
date_and_time
1    174.34
2    155.78
3    178.46
apple.price.resample('M').mean()
date_and_time
2018-01-31    174.34
2018-02-28    155.78
2018-03-31    178.46
Analyzing Police Activity with pandas

Resampling the volume

apple
date_and_time         price    volume          
2018-01-08 16:00:00  174.35  20567800
2018-01-09 16:00:00  174.33  21584000
2018-02-08 16:00:00  155.15  54390500
...                     ...       ...
apple.volume.resample('M').mean()
date_and_time
2018-01-31    21075900
2018-02-28    62531550
2018-03-31    27979650
Freq: M, Name: volume, Length: 3, dtype: float64
Analyzing Police Activity with pandas

Concatenating price and volume

monthly_price = apple.price.resample('M').mean()
monthly_volume = apple.volume.resample('M').mean()
pd.concat([monthly_price, monthly_volume], axis='columns')
date_and_time   price    volume
2018-01-31     174.34  21075900
2018-02-28     155.78  62531550
2018-03-31     178.46  27979650
monthly = pd.concat([monthly_price, monthly_volume],
                     axis='columns')
Analyzing Police Activity with pandas

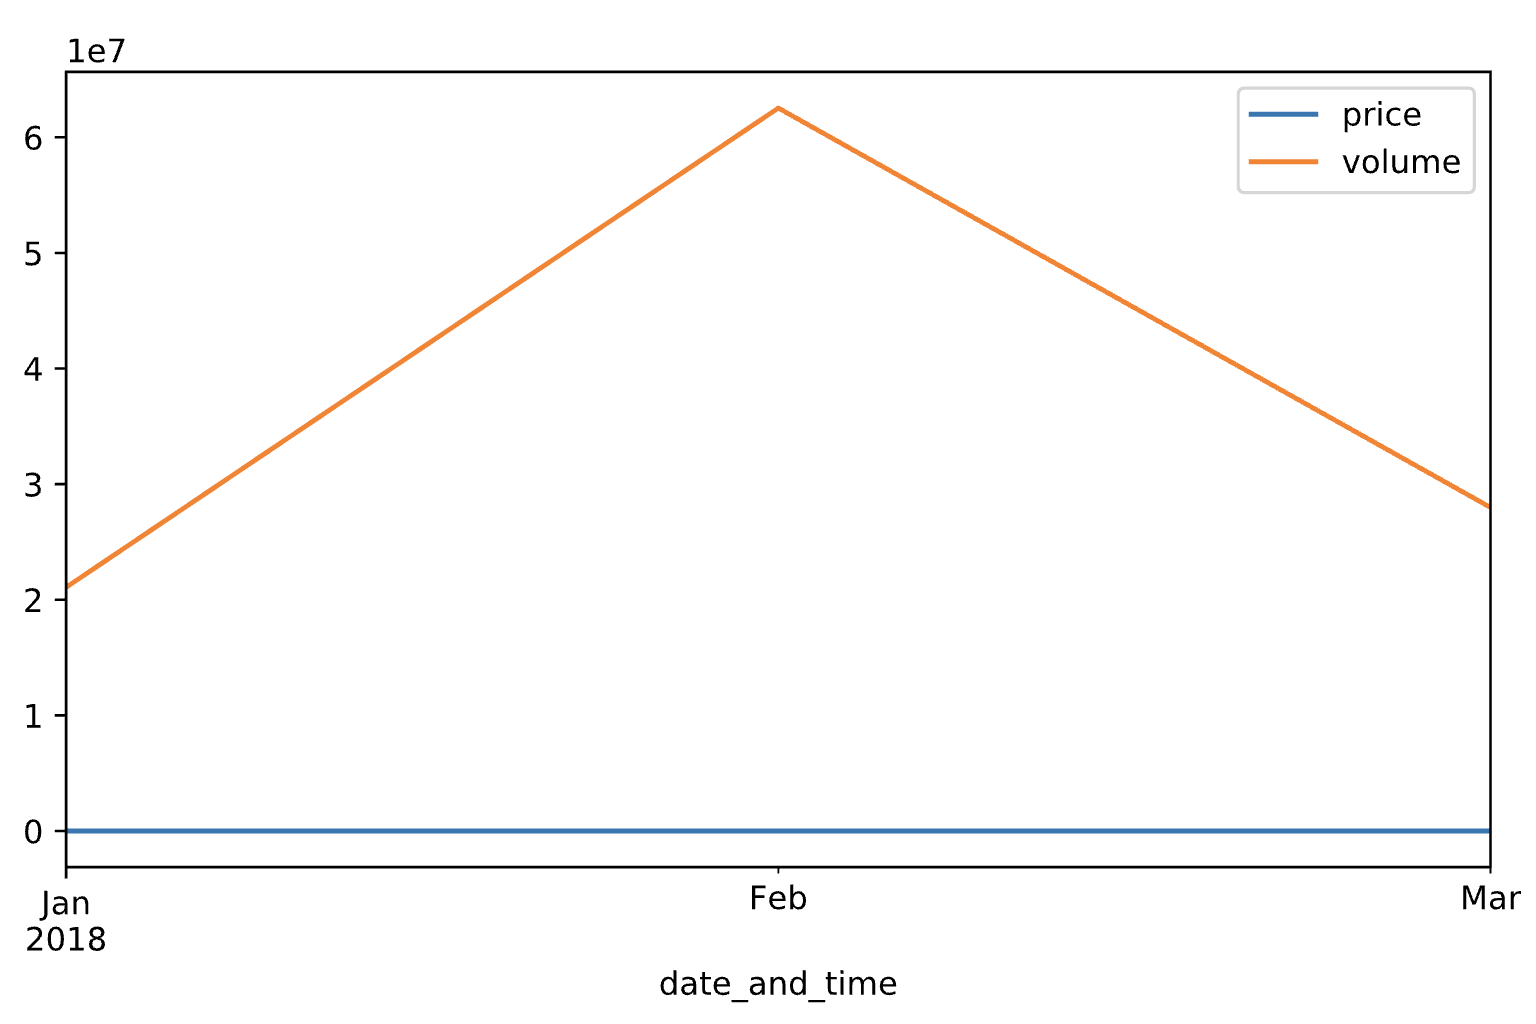
Plotting price and volume (1)

monthly.plot()
plt.show()

Single line plot of monthly mean price and volume for Apple stock

Analyzing Police Activity with pandas

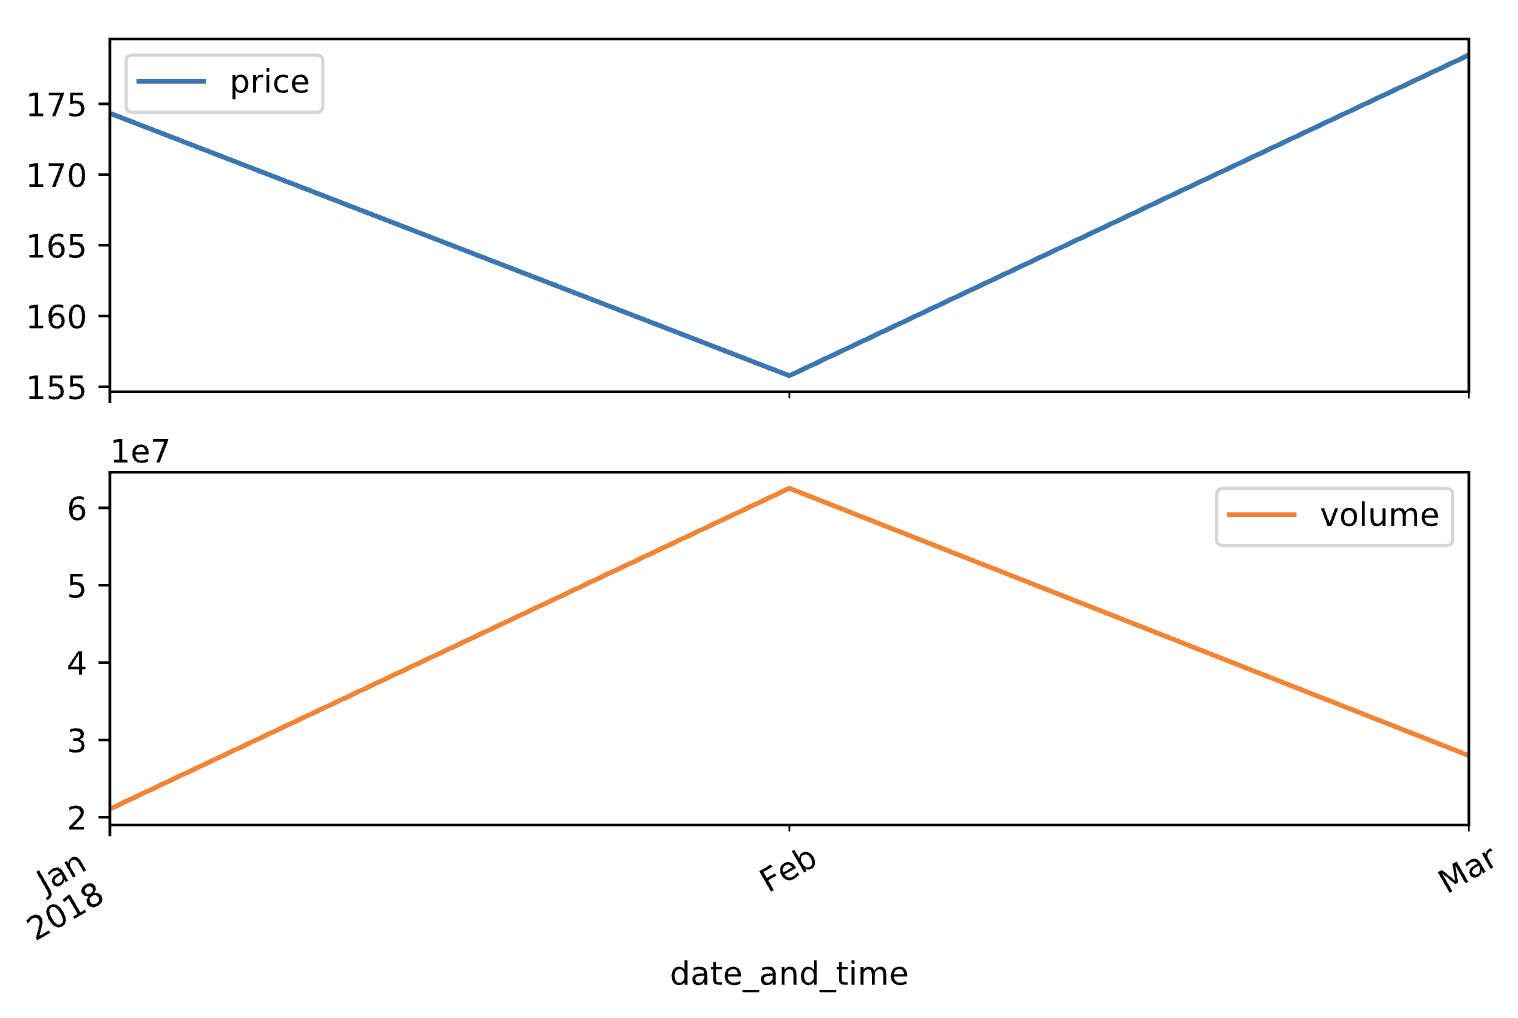
Plotting price and volume (2)

monthly.plot(subplots=True)
plt.show()

Separate line plots of monthly mean price and volume for Apple stock

Analyzing Police Activity with pandas

Let's practice!

Analyzing Police Activity with pandas

Preparing Video For Download...